matplotlib【グラフ描画ライブラリ】
メモ ( インストール方法 実行バージョンの取得 ) 全体操作 グラフ モジュール・クラス 設定・グラフパーツ ウィジェット
メモ
グラフ描画ライブラリ
- このドキュメントは、matplotlib 3.10 (2024-12-13) に一部対応 (最新)
- 公式サイトへの寄付
- トップページの [Support Matplotlib] ボタン
- インストール方法については、 Installation (英語) 参照
- Python・NumPy【科学技術計算】ライブラリ の最小対応バージョン
matplotlib
(3.10:2024-12-13)Python
(3.13:2024-10-07)
(3.8:サポート終了)NumPy
(2.2:2024-12-08)
(1.26:2023-09-16)3.10 3.10 1.23 3.9 3.9 1.23 3.8 3.9 1.21 3.7 3.8 1.20 3.6 3.8 1.19 3.5 3.7 1.17 3.4 3.7 1.16 3.3 3.6 1.15 3.2 3.6 1.11 3.1 3.6 1.11 3.0 3.5 1.10 - 実行バージョンの取得・比較〔 例 〕
- matplotlib:
- matplotlib.__version__
- matplotlib.__version_info__ 3.5
- matplotlib.__version__
- Python: ( Python 実行バージョン も参照 )
- platform.python_version()
- sys.version_info
- NumPy:
- numpy.__version__
- matplotlib:
各種一覧
外部リンク
全体操作
| 操作 | pyplot. | figure.Figure. | その他 |
|---|---|---|---|
| 図(フィギュア)作成 | figure【図作成】 | ||
| サブプロット | subplots【サブプロット作成】 subplot【サブプロット取得・設定】 delaxes【サブプロット 削除】 subplots_adjust【余白設定】 tight_layout【レイアウト自動調整】 subplot2grid gcf【現在フィギュア取得】 gca【現在座標系 取得】 | subplots【サブプロット作成】 delaxes【サブプロット 削除】 add_subplot【サブプロット追加】 tight_layout【レイアウト自動調整】 set_tight_layout【レイアウト自動調整 設定】 | figure.Figure.gca【現在座標系 取得】 figure.SubFigure.gca【現在座標系 取得】 axes.Axes.inset_axes【座標系 挿入】3.9 |
| 表示 | show【図表示】 pause【一定時間図表示】 ion【インタラクティブモード オン】 ioff【インタラクティブモード オフ】 close【図ウィンドウ クローズ】 | show【図表示】 | |
| アニメーション | animation.ArtistAnimation【アニメーション (固定セット)】 animation.FuncAnimation【アニメーション (関数)】 | ||
| ファイル保存 | savefig【ファイル保存】 | ||
| 手書き風 | xkcd【手書き風】 | ||
| スタイル | style.use【スタイル設定】 | ||
| アーティスト プロパティ | getp【アーティスト プロパティ取得】 setp【アーティスト プロパティ設定】 | set | |
| バックエンド | use【バックエンド選択】 get_backend【バックエンド名取得】 | ||
| 設定値 | RcParams【設定値クラス】 rcParams【設定値データ】 | get_configdir【設定ファイルディレクトリ取得】 matplotlib_fname【設定ファイル位置取得】 rcsetup【設定値検証】 | |
| 備考 | |
|---|---|
| 色 | 詳細は、color【色定義】参照 |
| マーカー | 詳細は、marker【マーカー定義】参照 |
| 日本語 | デフォルトのフォントは、日本語に対応していない為、設定が必要 |
| TeX | TeXの使用が可能 |
グラフ
| グラフ (基本グラフ) | pyplot. | axes.Axes. mpl_toolkits.mplot3d.axes3d. | |
|---|---|---|---|
| 棒グラフ |   | bar【棒グラフ (縦)】 barh【棒グラフ (横)】 応用 積み上げ棒グラフ 極座標グラフ 円グラフ ドーナツチャート | |
 | broken_barh【棒グラフ (横・非連続)】 | ||
 | Axes3D.bar【2D棒グラフ】 | ||
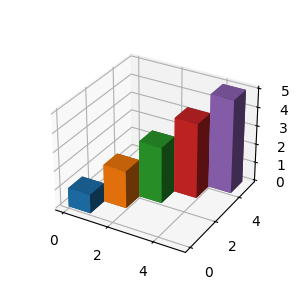 | Axes3D.bar3d【3D棒グラフ】 応用 3Dヒストグラム | ||
| 風向・風速 | 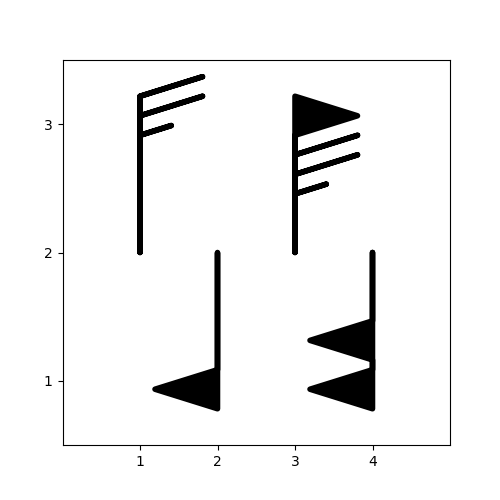 | barbs【風向・風速 (ノット)】 | |
| 箱ひげ図 | 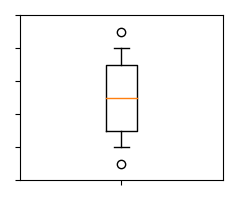 | boxplot【箱ひげ図 (データ指定)】3.1 / 3.2 / 3.4 / 3.6 / 3.93.10 | boxplot【箱ひげ図 (データ指定)】3.1 / 3.2 / 3.4 / 3.6 / 3.93.10 bxp【箱ひげ図 (要約統計量指定)】3.1 / 3.6 / 3.93.10 |
| コヒーレンス | 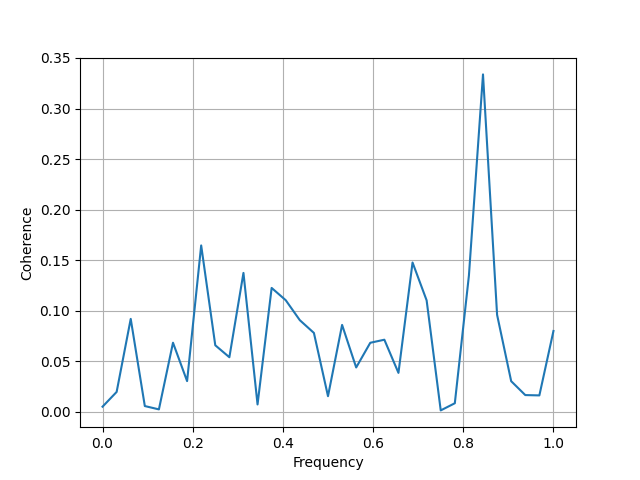 | cohere【コヒーレンス】 | |
| 等高線 | contour【等高線】 contourf【等高線 (塗りつぶし)】 tricontour【非構造三角形 等高線】 tricontourf【非構造三角形 等高線 (塗りつぶし)】 | ||
| Axes3D.contour (contour3D)【3D等高線】 Axes3D.contourf (contourf3D)【3D等高線 (塗りつぶし)】 Axes3D.tricontour【3D非構造三角形 等高線】 Axes3D.tricontourf【3D非構造三角形 等高線 (塗りつぶし)】 | |||
| 相関グラフ | acorr【自己相関グラフ】 xcorr【相互相関グラフ】 | ||
| エラーバー | 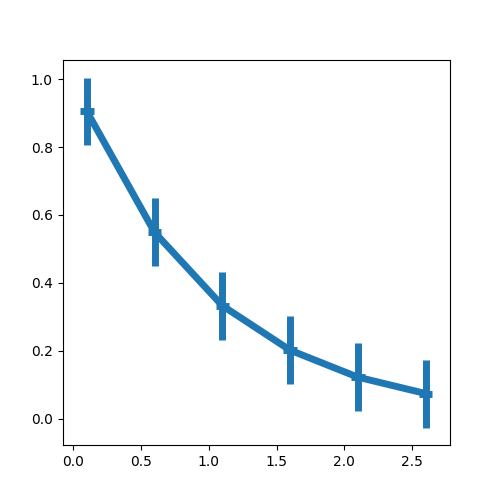 | errorbar【エラーバー】 | |
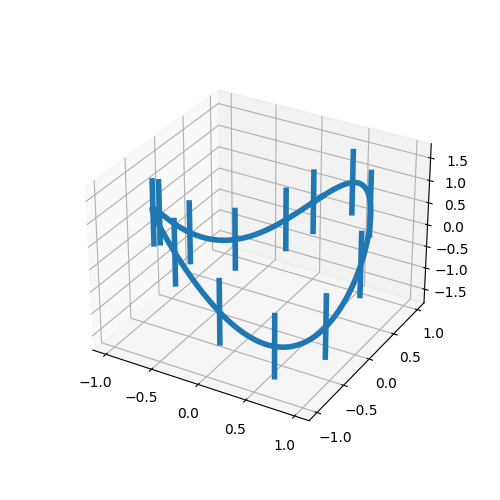 | Axes3D.errorbar【3Dエラーバー】 | ||
| スパイクラスター ドットラスター ラスタープロット | eventplot【イベントプロット】 | ||
| 六角形ビニング図 | 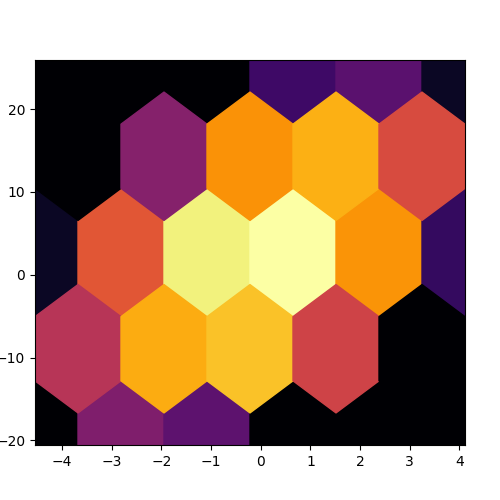 | hexbin【六角形ビニング図】 | |
| ヒストグラム | 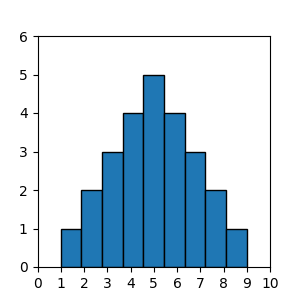 | hist【ヒストグラム】3.10 | |
 | hist2d【2次元ヒストグラム】 | ||
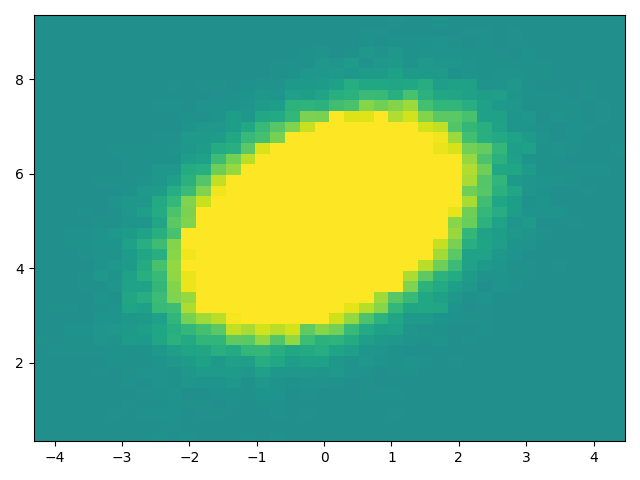
| 画像データ | 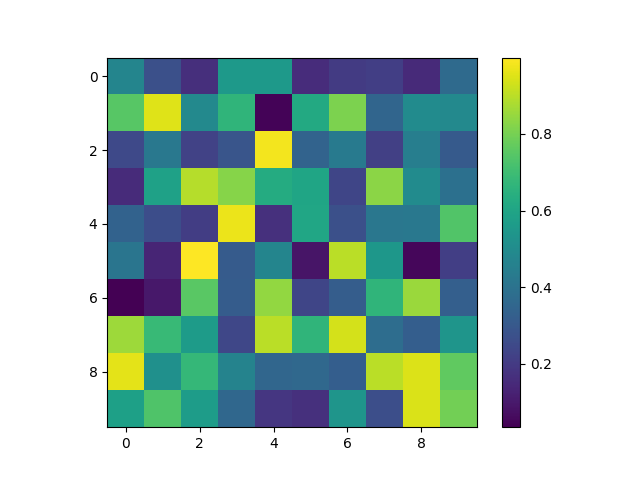 | imshow【画像データ表示】3.7 matshow【配列画像表示】 pcolor【疑似カラープロット】 pcolormesh【疑似カラープロット (高速)】3.7 pcolorfast【疑似カラープロット (最速:実験的)】 tripcolor【疑似カラープロット (非構造化三角グリッド)】 | |
| 対数グラフ | loglog【両対数グラフ】 semilogx【x軸片対数グラフ】 semilogy【y軸片対数グラフ】 | ||
| 円グラフ | 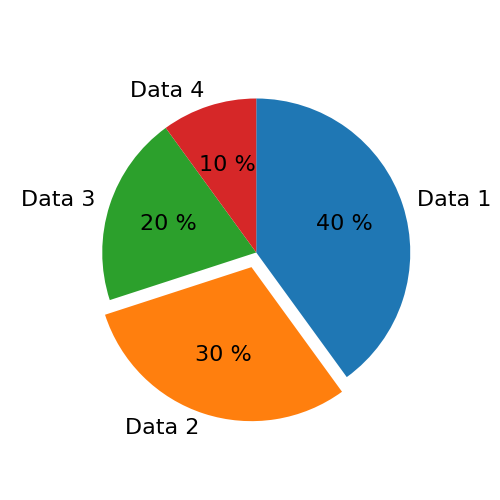 | pie【円グラフ】3.1 / 3.3 / 3.7 / 3.8 応用 ドーナツチャート | |
| 折れ線グラフ | 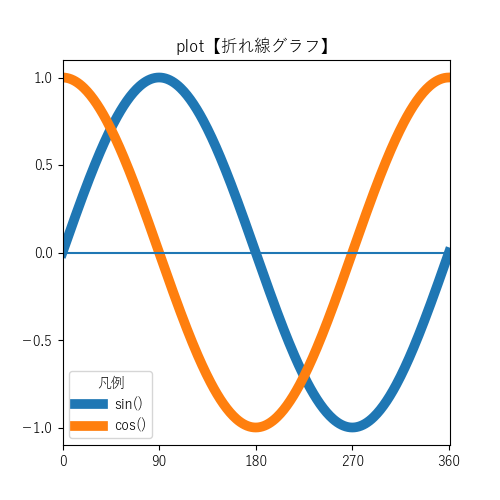 | plot【折れ線グラフ】 応用 散布図 レーダーチャート 折れ線グラフ (時系列) タイムライン | |
 | step【折れ線グラフ (ステップ)】 | ||
 | stairs【折れ線グラフ (段階的定数)】3.4 | ||
 | plot_date【折れ線グラフ (時系列)】3.5 | ||
 | stackplot【折れ線グラフ (積み上げ)】3.9 応用 テーマリバーグラフ ストリームグラフ | ||
 | Axes3D.plot (plot3D)【3D折れ線グラフ】 応用 3D散布図 | ||
| 3D面 |  | Axes3D.plot_surface【3D曲面】 | |
 | Axes3D.plot_trisurf【3D三角面】 | ||
 | Axes3D.plot_wireframe【ワイヤーフレーム】 | ||
| 極座標 | polar【極座標プロット】 | (projection) | |
| ベクトル |  | quiver【ベクトル】 | |
| Axes3D.quiver (quiver3D)【3Dベクトル】 | |||
| 散布図 |  | scatter【散布図】 | |
 | Axes3D.scatter (scatter3D)【3D散布図】 | ||
| スペクトログラム |  | specgram【スペクトログラム】 angle_spectrum【角度スペクトル】 magnitude_spectrum【振幅スペクトル】 phase_spectrum【位相スペクトル】 csd【クロススペクトル密度】 psd【パワースペクトル密度】 | |
| 疎行列 | spy【疎行列プロット】 | ||
| ステムプロット |  | stem【ステムプロット】3.6 | |
| Axes3D.stem (stem3D)【3Dステムプロット】 | |||
| 流線グラフ |  | streamplot【流線グラフ】 | |
| バイオリン図 |  | violinplot【バイオリン図 (データ指定)】3.2 / 3.93.10 | violinplot【バイオリン図 (データ指定)】3.2 / 3.93.10 violin【バイオリン図 (データ分布指定)】3.2 / 3.93.10 |
| ボクセル |  | Axes3D.voxels【ボクセル】 | |
モジュール・クラス
グラフの引数・戻り値等 (一部抜粋)
| モジュール・クラス等 matplotlib. | 説明 | 関連グラフ等 | |
|---|---|---|---|
| image. | AxesImage | imshow【画像データ表示】 matshow【配列画像表示】 pcolorfast【疑似カラープロット (最速:実験的)】 specgram【スペクトログラム】 spy【疎行列プロット】 | |
| quiver. | Barbs | barbs【風向・風速 (ノット)】 | |
| container. | BarContainer | バーコンテナ | bar【棒グラフ (縦)】 barh【棒グラフ (横)】 |
| collections. | BrokenBarHCollection | broken_barh【棒グラフ (横・非連続)】 | |
| collections. | Collection | pcolor【疑似カラープロット】 scatter【散布図】 Axes3D.scatter3D【3D散布図】 tripcolor【疑似カラープロット (非構造化三角グリッド)】 | |
| colors 3.1・3.2・3.3 | 色関連モジュール 詳細は、color【色定義】 参照 | 全般 | |
| axes.Axes. | contour | contour【等高線】 contourf【等高線 (塗りつぶし)】 Axes3D.contour[3D]【3D等高線】 Axes3D.contourf[3D]【3D等高線 (塗りつぶし)】 | |
| container. | ErrorbarContainer | エラーバーコンテナ | errorbar【エラーバー】 |
| collections. | EventCollection | eventplot【イベントプロット】 | |
| ticker. | Formatter【フォーマッタ (基本)】 EngFormatter【フォーマッタ (工学)】3.1 / 3.83.10 FixedFormatter【フォーマッタ (固定)】 FormatStrFormatter【フォーマッタ (旧フォーマット文字列)】 FuncFormatter【フォーマッタ (ユーザー定義関数)】 IndexDateFormatter 3.33.5 IndexFormatter 3.33.5 LogFormatter【対数フォーマッタ (基本)】 LogFormatterExponent【対数フォーマッタ (指数)】 LogFormatterMathtext LogFormatterSciNotation LogitFormatter NullFormatter【フォーマッタ (ヌル)】 OldScalarFormatter 3.33.5 PercentFormatter【フォーマッタ (パーセント)】 ScalarFormatter【フォーマッタ (スカラー)】3.1/ 3.3/ 3.43.10 StrMethodFormatter【フォーマッタ (新フォーマット文字列)】3.9 | フォーマッタ | 全般 |
| dates. | ConciseDateFormatter【日付フォーマッタ (簡潔)】3.1 DateFormatter【日付フォーマッタ】 AutoDateFormatter【日付フォーマッタ (自動)】 | ||
| category. | StrCategoryFormatter | ||
| legend. | Legend 3.5 / 3.7 / 3.8 | 凡例 | 全般 |
| lines. | Line2D | 線分 | cohere【コヒーレンス】 acorr【自己相関グラフ】 xcorr【相互相関グラフ】 errorbar【エラーバー】 plot【折れ線グラフ】 step【折れ線グラフ (ステップ)】 plot_date【折れ線グラフ (時系列)】3.5 Axes3D.plot[3D]【3D折れ線グラフ】 polar【極座標プロット】 angle_spectrum【角度スペクトル】 magnitude_spectrum【振幅スペクトル】 phase_spectrum【位相スペクトル】 csd【クロススペクトル密度】 psd【パワースペクトル密度】 spy【疎行列プロット】 stem【ステムプロット】 ■グラフパーツ グリッド線 axhline【水平線 (単一)】 axvline【垂直線 (単一)】 axline【直線】3.3 |
| mpl_toolkits.mplot3d.art3d. | Line3D | 3D線分 | Axes3D.errorbar【3Dエラーバー】 Axes3D.plot3D【3D折れ線グラフ】 loglog【両対数グラフ】 semilogx【x軸片対数グラフ】 semilogy【y軸片対数グラフ】 |
| mpl_toolkits.mplot3d.art3d. | Line3DCollection | Axes3D.plot_wireframe【ワイヤーフレーム】 | |
| collections. | LineCollection | Axes3D.quiver[3D]【3Dベクトル】 stem【ステムプロット】 streamplot【流線グラフ】 violinplot【バイオリン図 (データ指定)】 violin【バイオリン図 (データ分布指定)】 ■グラフパーツ hlines【水平線 (複数)】3.3 vlines【垂直線 (複数)】3.3 | |
| markers | マーカー関連モジュール 詳細は、marker【マーカー定義】 参照 | ||
| patches. | Patch | 区画 | 各種図形 |
| mpl_toolkits.mplot3d.art3d. | Patch3DCollection | Axes3D.bar【2D棒グラフ追加】 | |
| collections. | PathCollection | scatter【散布図】 Axes3D.scatter[3D]【3D散布図】 streamplot【流線グラフ】 | |
| image. | PcolorImage | pcolorfast【疑似カラープロット (最速:実験的)】 | |
| axes.Axes. | pcolormesh | hist2d【2次元ヒストグラム】 | |
| mpl_toolkits.mplot3d.art3d. | Poly3DCollection3.7 | Axes3D.bar3d【3D棒グラフ】 Axes3D.voxels【ボクセル】 | |
| collections. | PolyCollection | hexbin【六角形ビニング図】 pcolor【疑似カラープロット】 stackplot【折れ線グラフ (積み上げ)】 tripcolor【疑似カラープロット (非構造化三角グリッド)】 Axes3D.plot_surface【3D曲面】 Axes3D.plot_trisurf【3D三角面】 quiver【ベクトル】 violinplot【バイオリン図 (データ指定)】 violin【バイオリン図 (データ分布指定)】 | |
| patches. | Polygon | 多角形 | ■グラフパーツ |
| contour. | QuadContourSet | contour【等高線】 contourf【等高線 (塗りつぶし)】 Axes3D.contour[3D]【3D等高線】 Axes3D.contourf[3D]【3D等高線 (塗りつぶし)】 | |
| collections. | QuadMesh | hist2d【2次元ヒストグラム】 pcolormesh【疑似カラープロット (高速)】 pcolorfast【疑似カラープロット (最速:実験的)】 | |
| patches. | Rectangle | 長方形 | bar【棒グラフ (縦)】 barh【棒グラフ (横)】 Axes3D.bar【2D棒グラフ追加】 ■グラフパーツ axhspan【水平範囲】3.9 axvspan【垂直範囲】3.9 |
| patches. | Shadow 3.8 | 影 | legend【凡例 設定】 pie【円グラフ】 |
| container. | StemContainer | stem【ステムプロット】 Axes3D.stem[3D]【3Dステムプロット】 | |
| patches. | StepPatch | stairs【折れ線グラフ (段階的定数)】3.4 | |
| text. | Text 3.5 | テキスト | タイトル 軸ラベル pie【円グラフ】 |
| tri. | Triangulation | tricontour【非構造三角形 等高線】 tricontourf【非構造三角形 等高線 (塗りつぶし)】 Axes3D.tricontour【3D非構造三角形 等高線】 Axes3D.tricontourf【3D非構造三角形 等高線 (塗りつぶし)】 tripcolor【疑似カラープロット (非構造化三角グリッド)】 Axes3D.plot_trisurf【3D三角面】 | |
| tri. | TriContourSet | tricontour【非構造三角形 等高線】 tricontourf【非構造三角形 等高線 (塗りつぶし)】 Axes3D.tricontour【3D非構造三角形 等高線】 Axes3D.tricontourf【3D非構造三角形 等高線 (塗りつぶし)】 | |
| patches. | Wedge | くさび形 | pie【円グラフ】 |
設定・グラフパーツ
| pyplot. | axes.Axes. mpl_toolkits.mplot3d.axes3d. | その他 | |
|---|---|---|---|
| タイトル | suptitle【タイトル設定 (全体)】 title【タイトル設定】 | set_title【タイトル設定】 get_title【タイトル取得】 Axes3D.set_title【タイトル設定】 | figure.Figure.suptitle【タイトル設定 (全体)】 figure.SubFigure.suptitle figure.Figure.align_titles【タイトル調整】3.9 |
| 凡例 | legend【凡例 設定】3.5 / 3.7 / 3.8 quiverkey【ベクトルの凡例 追加】 | figure.Figure.legend【凡例 設定 (全体)】3.7 / 3.8 PathCollection.legend_elements【凡例項目作成】 | |
| get_legend【凡例 取得】 get_legend_handles_labels【凡例 取得 (ハンドル・ラベル)】 | |||
| 軸ラベル | xlabel【x軸ラベル 設定】3.3 ylabel【y軸ラベル 設定】3.3 | set_xlabel【x軸ラベル 設定】3.3 set_ylabel【y軸ラベル 設定】3.3 Axes3D.set_zlabel【z軸ラベル 設定】 get_xlabel【x軸ラベル 取得】 get_ylabel【y軸ラベル 取得】 Axes3D.get_zlabel【z軸ラベル 取得】 | align_labels【ラベル調整】 figure.Figure.supxlabel【x軸ラベル(全体) 設定】3.43.6 figure.Figure.supylabel【y軸ラベル(全体) 設定】3.43.6 figure.SubFigure.supxlabel figure.SubFigure.supylabel projections.polar.PolarAxes.set_rlabel_position【半径ラベルのシータ位置設定】 |
| clabel【等高線ラベル 設定】 | |||
| グリッド線 | grid【グリッド線 設定】3.5 | grid【グリッド線 設定】3.5 get_xgridlines【x軸グリッド線 取得】 get_ygridlines【y軸グリッド線 取得】 (Axes3D.grid【3Dグリッド線 取得・設定】) Axes3D.get_zgridlines【z軸グリッド線 取得】 | axis.Axis.grid【軸グリッド線 設定】3.5 axis.Axis.get_gridlines【軸グリッド線 取得】 |
| triplot【三角形分割】 | |||
| rgrids【放射状グリッド線 取得・設定】 thetagrid【放射状シータグリッド線 取得・設定】 | projections.polar.PolarAxes.set_rgrids【放射状グリッド線 設定】 projections.polar.PolarAxes.set_thetagrid【放射状シータグリッド線 設定】 | ||
| 表示範囲 | xlim【x軸表示範囲 取得・設定】 ylim【y軸表示範囲 取得・設定】 axis【表示範囲等 取得・設定】3.1~3.4 / 3.7 | set_xlim【x軸表示範囲 設定】3.1 / 3.6 set_ylim【y軸表示範囲 設定】3.1 / 3.6 get_xlim【x軸表示範囲 取得】 get_ylim【y軸表示範囲 取得】 axis【表示範囲等 取得・設定】3.1~3.4 / 3.7 | projections.polar.PolarAxes.set_rlim【極座標範囲 設定】 |
| Axes3D.set_xlim【3D x軸表示範囲 設定】 Axes3D.set_xlim3d【3D x軸表示範囲 設定】 Axes3D.set_ylim【3D y軸表示範囲 設定】 Axes3D.set_ylim3d【3D y軸表示範囲 設定】 Axes3D.set_zlim【3D z軸表示範囲 設定】 Axes3D.set_zlim3d【3D z軸表示範囲 設定】 Axes3D.get_xlim3d【3D x軸表示範囲 取得】 Axes3D.get_ylim3d【3D y軸表示範囲 取得】 Axes3D.get_zlim3d【3D z軸表示範囲 取得】 | |||
| データ上限・下限 | set_xbound【x軸データ上限・下限 設定】 set_ybound【y軸データ上限・下限 設定】 get_xbound【x軸データ上限・下限 取得】 get_ybound【y軸データ上限・下限 取得】 | projections.polar.PolarAxes.set_rmax【極座標上限 設定】 projections.polar.PolarAxes.set_rmin【極座標下限 設定】 | |
| 目盛り | xticks【x軸目盛り (ラベル) 取得・設定】3.6 yticks【y軸目盛り (ラベル) 取得・設定】3.6 locator_params【目盛り制御】 minorticks_on minorticks_off ticklabel_format【目盛りフォーマット設定 (指数形式)】 tick_params【目盛り・グリッド線 外観変更】 | set_xticks【x軸目盛り 設定】3.2 / 3.5 set_yticks【y軸目盛り 設定】3.2 / 3.5 Axes3D.set_zticks【z軸目盛り 設定】 set_xticklabels【x軸目盛りラベル 設定】3.3 / 3.5 set_yticklabels【y軸目盛りラベル 設定】3.3 / 3.5 Axes3D.set_zticklabels【z軸目盛りラベル 設定】 get_xticks【x軸目盛り 取得】3.2 get_yticks【y軸目盛り 取得】3.2 Axes3D.get_zticks【z軸目盛り 取得】 get_xticklabels【x軸目盛りラベル 取得】3.3 / 3.6 get_yticklabels【y軸目盛りラベル 取得】3.3 / 3.6 Axes3D.get_zticklabels【z軸目盛りラベル 取得】 get_xmajorticklabels【x軸目盛りラベル 取得 (主)】3.3 / 3.6 get_ymajorticklabels【y軸目盛りラベル 取得 (主)】3.3 / 3.6 get_xminorticklabels【x軸目盛りラベル 取得 (補助)】3.3 / 3.6 get_yminorticklabels【y軸目盛りラベル 取得 (補助)】3.3 / 3.6 get_xticklines get_yticklines xaxis_date yaxis_date minorticks_on minorticks_off ticklabel_format【目盛りフォーマット設定 (指数形式)】 tick_params【目盛り・グリッド線 外観変更】 locator_params【目盛り制御】 fmt_xdata fmt_ydata | ticker【目盛りモジュール】 axis.Axis.set_ticks【目盛り 設定】 axis.Axis.set_ticklabels【目盛りラベル 設定】 axis.Axis.set_tick_params【目盛り・グリッド線 外観変更】 axis.XAxis.set_ticks_position【x軸目盛り位置 設定】 axis.YAxis.set_ticks_position【y軸目盛り位置 設定】 Axes3D.locator_params【目盛り制御】 axis.Axis.set_major_formatter【フォーマッタ設定 (主)】 axis.Axis.set_minor_formatter【フォーマッタ設定 (補助)】 axis.Axis.set_major_locator【ロケータ設定 (主)】 axis.Axis.set_minor_locator【ロケータ設定 (補助)】 axis.Axis.get_ticklabels【目盛りラベル取得】 axis.Axis.get_majorticklabels【目盛りラベル取得 (主)】 axis.Axis.get_minorticklabels【目盛りラベル取得 (補助)】 axis.Axis.get_major_formatter【フォーマッタ取得 (主)】 axis.Axis.get_minor_formatter【フォーマッタ取得 (補助)】 axis.Axis.get_ticklocs axis.Axis.get_major_locator【ロケータ取得 (主)】 axis.Axis.get_minor_locator【ロケータ取得 (補助)】 figure.Figure.autofmt_xdate【x軸日付目盛りラベル回転】 axis.Axis.get_tick_params【目盛り・グリッド線 外観取得】3.7 |
| 表示関連 | box【外枠表示 設定】 | set_axis_on【軸関連 表示】 set_axis_off【軸関連 非表示】 set_frame_on【外枠表示 設定】 get_frame_on【外枠表示 取得】 set_axisbelow get_axisbelow set_xmargin【x軸マージン 設定】 set_xmargin【y軸マージン 設定】 Axes3D.set_xmargin【z軸マージン 設定】 get_xmargin【x軸マージン 取得】3.9 get_xmargin【y軸マージン 取得】3.9 Axes3D.get_xmargin【z軸マージン 取得】3.9 Axes3D.view_init【軸回転】 | |
| 軸スケール | xscale【x軸スケール 設定】 yscale【y軸スケール 設定】 | set_xscale【x軸スケール 設定】 set_yscale【y軸スケール 設定】 Axes3D.set_zscale【z軸スケール 設定】 get_xscale【x軸スケール 取得】 get_yscale【y軸スケール 取得】 Axes3D.get_zscale【z軸スケール 取得】 | |
| 軸移動 | ax1.spines['left'].set_position('zero') ax1.spines['bottom'].set_position('zero') axes.Axes.set_position | ||
| 軸方向 | invert_xaxis【x軸方向反転】 xaxis_inverted【x軸方向取得】 invert_yaxis【y軸方向反転】 yaxis_inverted【y軸方向取得】 | ||
| 軸共有 | twinx【x軸共有】 twiny【y軸共有】 | ||
| 別軸 | secondary_xaxis【第2x軸追加】 secondary_yaxis【第2y軸追加】 indicate_inset【インジケータ長方形追加】 indicate_inset_zoom【ズームインジケータ長方形追加】3.0 | ||
| 直線 範囲 | axhline【水平線 (単一)】3.9 axvline【垂直線 (単一)】 hlines【水平線 (複数)】3.3 vlines【垂直線 (複数)】3.3 axhspan【水平範囲】3.9 axvspan【垂直範囲】3.9 axline【直線】3.3 | ||
| アノテーション | annotate【アノテーション】 | ||
| テキスト | text【テキスト追加】 figtext【フィギュアテキスト追加】 | text【テキスト追加】 | |
| Axes3D.text2D【テキスト追加】 Axes3D.text (text3D)【3Dテキスト追加】 | |||
| 表 | table | ||
| 背景色 | set_facecolor【背景色 設定】 get_facecolor【背景色 取得】 | ||
| カラーバー | colorbar【カラーバー追加】 | ||
| 塗り潰し | fill【ポリゴンの塗り潰し】 fill_between【水平曲線領域の塗り潰し】 fill_betweenx【垂直曲線領域の塗り潰し】 | ||
| 図形 | arrow【矢印】 | ||
| add_patch【図形追加】 | patches.Arc【弧】 patches.ArrowStyle【矢印コンテナ】 patches.Arrow【矢印】3.9 patches.BoxStyle【ボックスコンテナ】 patches.CirclePolygon【多角形円】 patches.Circle【円】 patches.ConnectionPatch【接続パッチ】 patches.ConnectionStyle【接続コンテナ】 patches.Ellipse【楕円】 patches.FancyArrowPatch【】 patches.FancyArrow【装飾矢印】 patches.FancyBboxPatch【装飾長方形】3.7 patches.Patch【パッチ】 patches.PathPatch【パス】 patches.Polygon【多角形】 patches.Rectangle【長方形】 patches.RegularPolygon【正多角形】 patches.Shadow【影】 patches.StepPatch【階段状】 patches.Wedge【くさび形】 | ||
| Zオーダー | set_axisbelow【Zオーダー簡易設定 (目盛り・グリッド線)】 get_axisbelow【Zオーダー簡易取得 (目盛り・グリッド線)】 | artist.Artist.set_zorder【Zオーダー設定】 | |
ウィジェット
| widgets. | |
|---|---|
| ウィジェット | Button【ボタン】3.4 CheckButtons【チェックボタン】3.4 / 3.7 / 3.9 Cursor【カーソル】 Lasso【自由曲線】 MultiCursor【マルチカーソル】 RadioButtons【ラジオボタン】3.4 / 3.7 / 3.9 RangeSlider【範囲スライダー】3.4 Slider【スライダー】3.4 TextBox【テキストボックス】3.4 Widget【ウィジェット抽象基本クラス】 |
| セレクタ | EllipseSelector【楕円セレクタ】 LassoSelector【自由曲線セレクタ】 PolygonSelector【多角形セレクタ】 RectangleSelector【長方形セレクタ】 SpanSelector【範囲セレクタ】 |
例
実行バージョン
【matplotlib】
import matplotlib

print(matplotlib.__version__)
# 出力例:3.9.2
print(matplotlib.__version_info__)  # [3.5~]
# 出力例:_VersionInfo(major=3, minor=9, micro=2, releaselevel='final', serial=0)
major, minor, micro, releaselevel, serial = matplotlib.__version_info__
print(major, minor, micro, releaselevel, serial)
# 出力:3 9 2 final 0
print(type(major), type(minor), type(micro), type(releaselevel), type(serial))
# 出力:<class 'int'> <class 'int'> <class 'int'> <class 'str'> <class 'int'>

# 比較
print(matplotlib.__version_info__ >= (3, 8))
# 出力例:True
print(matplotlib.__version_info__ >= (3, 9))
# 出力例:True
print(matplotlib.__version_info__ >= (3, 10))
# 出力例:False
【Python】
import platform
import sys

print(platform.python_version())
# 出力例:3.12.5
print(sys.version_info)
# 出力例:sys.version_info(major=3, minor=12, micro=5, releaselevel='final', serial=0)

# 比較
print(sys.version_info >= (3, 11))
# 出力例:True
print(sys.version_info >= (3, 12))
# 出力例:True
print(sys.version_info >= (3, 13))
# 出力例:False
【numpy】
import numpy

print(numpy.__version__)
# 出力例:1.26.4