軸ラベル関連
Figure.supxlabel・Figure.supylabel【x・y軸ラベル(全体) 設定】3.43.6
Axes.set_xlabel・Axes.set_ylabel【x・y軸ラベル 設定】3.3
Axes.get_xlabel・Axes.get_ylabel【x・y軸ラベル 取得】3.3
pyplot.xlabel・pyplot.ylabel【x・y軸ラベル 設定】
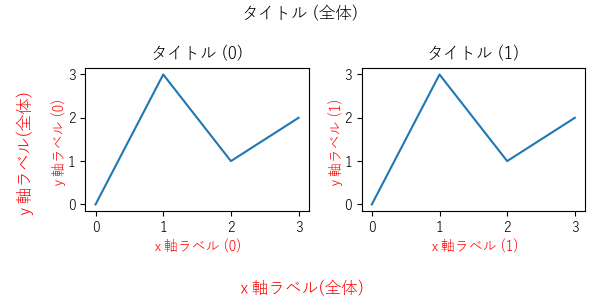
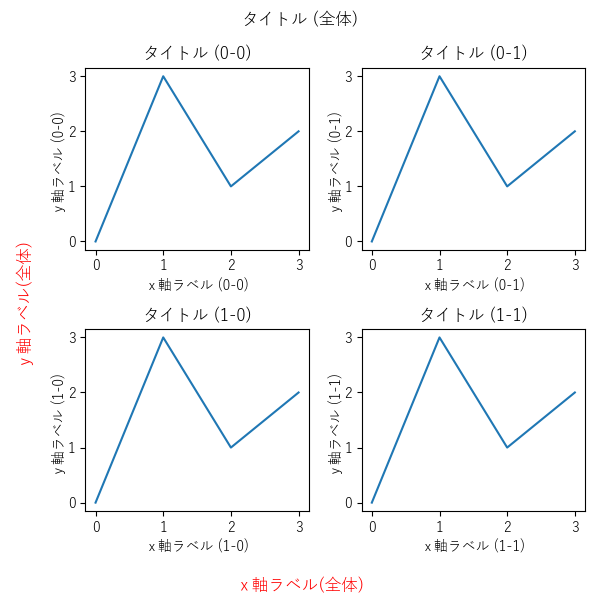
figure.Figure.supxlabel【x軸ラベル(全体) 設定】3.43.6
figure.Figure.supylabel【y軸ラベル(全体) 設定】3.43.6
メモ
- 軸ラベル(全体)の設定
- レイアウトが崩れる場合、tight_layout【レイアウト自動調整】等で調整
関連
外部リンク
構文
matplotlib.figure.Figure.supxlabel(t, **kwargs) 3.4
matplotlib.figure.Figure.supylabel(t, **kwargs) 3.4
 (Text)ラベルのText【テキスト】インスタンス
t (str)軸ラベル(全体)のテキスト
kwargs (キーワード引数)その他の引数 (下記参照)
| 引数 | 備考 | supxlabel デフォルト値 | supylabel デフォルト値 |
|---|---|---|---|
| x (float) | x方向位置 (単位:軸の長さを1.0) | 0.5 | 0.02 |
| y (float) | y方向位置 (単位:軸の長さを1.0) | 0.01 | 0.5 |
| horizontalalignment ha (str) | 水平方向の揃え 以下の値 'center' 'left' 'right' | 'center' | 'left' |
| verticalalignment va (str) | 垂直方向の揃え 以下の値 'top' 'center' 'bottom' 'baseline' | 'bottom' | 'center' |
| fontsize size | フォントサイズ | 'large' rcParams["figure.labelsize"]3.6 | |
| fontweight weight | フォントの太さ | 'normal' rcParams["figure.labelweight"]3.6 | |
| fontproperties (None | dict) | フォント プロパティ (辞書形式) | 上記の fontsize・size【フォントサイズ】 fontweight・weight【フォントの太さ】 を上書き rcParams["figure.labelsize"]3.6 rcParams["figure.labelweight"]3.6 | |
| その他 Text【テキスト】 参照 | その他テキスト プロパティ | ||
例
import matplotlib.pyplot as plt

# 初期設定
plt.rcParams['font.family'] = 'sans-serif'
plt.rcParams['font.sans-serif'] =\
    ['Yu Gothic', 'Hiragino Maru Gothic Pro', 'Noto Sans CJK JP']
fig, axs = plt.subplots(
    2, 2,
    figsize=(6, 6),
    tight_layout=True,
)
x = [0, 1, 2, 3]
y = [0, 3, 1, 2]

# タイトル (全体)・軸ラベル(全体)
fig.suptitle('タイトル (全体)')
fig.supxlabel(
    'x軸ラベル(全体)',
    color='red',
)
supylabel = fig.supylabel(
    'y軸ラベル(全体)',
    # color='red',  # 下記で同等の処理
)
supylabel.set_color('red')

# グラフ (0-0)
axs[0, 0].set_title('タイトル (0-0)')
axs[0, 0].plot(x, y)
axs[0, 0].set_xticks(x)
axs[0, 0].set_yticks(y)
axs[0, 0].set_xlabel('x軸ラベル (0-0)')
axs[0, 0].set_ylabel('y軸ラベル (0-0)')

# グラフ (0-1)
axs[0, 1].set_title('タイトル (0-1)')
axs[0, 1].plot(x, y)
axs[0, 1].set_xticks(x)
axs[0, 1].set_yticks(y)
axs[0, 1].set_xlabel('x軸ラベル (0-1)')
axs[0, 1].set_ylabel('y軸ラベル (0-1)')

# グラフ (1-0)
axs[1, 0].set_title('タイトル (1-0)')
axs[1, 0].plot(x, y)
axs[1, 0].set_xticks(x)
axs[1, 0].set_yticks(y)
axs[1, 0].set_xlabel('x軸ラベル (1-0)')
axs[1, 0].set_ylabel('y軸ラベル (1-0)')

# グラフ (1-1)
axs[1, 1].set_title('タイトル (1-1)')
axs[1, 1].plot(x, y)
axs[1, 1].set_xticks(x)
axs[1, 1].set_yticks(y)
axs[1, 1].set_xlabel('x軸ラベル (1-1)')
axs[1, 1].set_ylabel('y軸ラベル (1-1)')

# 表示
plt.show()
Axes.set_xlabel【x軸ラベル 設定】3.3
Axes.set_ylabel【y軸ラベル 設定】3.3
pyplot.xlabel【x軸ラベル 設定】3.3
pyplot.ylabel【y軸ラベル 設定】3.3
Axes.get_xlabel【x軸ラベル 取得】
Axes.get_ylabel【y軸ラベル 取得】
メモ
- 軸ラベルの設定・取得
- レイアウトが崩れる場合、tight_layout【レイアウト自動調整】等で調整
関連
外部リンク
構文
matplotlib.axes.Axes.set_xlabel(xlabel, fontdict=None, labelpad=None, *3.3, loc3.3 =None, **kwargs)
matplotlib.pyplot.xlabel(同上)
xlabel (str)x軸ラベルテキスト (改行:'\n')
fontdict (dict)Text【テキスト】プロパティ (辞書型)
labelpad (float)目盛りラベル等からの距離 (ポイント単位 / 負数:内側)
    (デフォルト:rcParams["axes.labelpad"] 4.0)
以下キーワード引数 3.3
loc ('left' | 'center' | 'right')3.3ラベル位置 (デフォルト:rcParams["xaxis.labellocation"] 'center')
kwargsText【テキスト】プロパティ
matplotlib.axes.Axes.set_ylabel(ylabel, fontdict=None, labelpad=None, *3.3, loc3.3 =None, **kwargs)
matplotlib.pyplot.ylabel(同上)
ylabel (str)y軸ラベルテキスト (改行:'\n')
fontdict (dict)Text【テキスト】プロパティ (辞書型)
labelpad (float)目盛りラベル等からの距離 (ポイント単位 / 負数:内側)
    (デフォルト:rcParams["axes.labelpad"] 4.0)
以下キーワード引数 3.3
loc ('bottom' | 'center' | 'top')3.3ラベル位置 (デフォルト:rcParams["yaxis.labellocation"] 'center')
kwargsText【テキスト】プロパティ
matplotlib.axes.Axes.get_xlabel()

 (str)x軸ラベルテキスト
matplotlib.axes.Axes.get_ylabel()

 (str)y軸ラベルテキスト
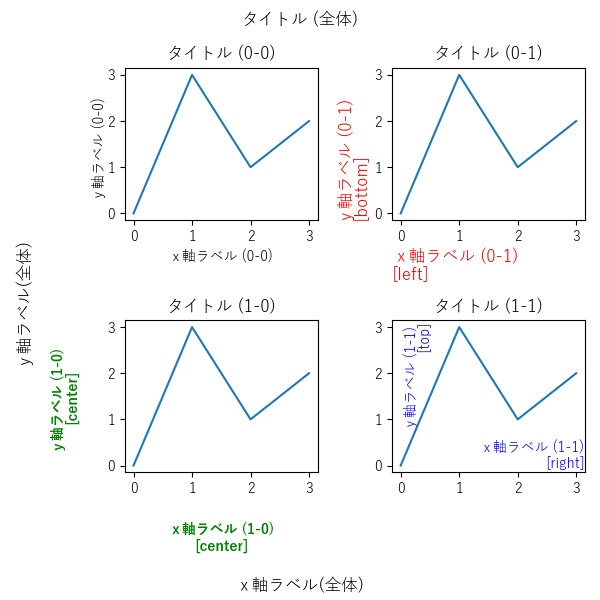
例:Axes.set_xlabel【x軸ラベル 設定】・Axes.set_ylabel【y軸ラベル 設定】・Axes.get_xlabel【x軸ラベル 取得】・Axes.get_ylabel【y軸ラベル 取得】
import matplotlib.pyplot as plt

# 初期設定
plt.rcParams['font.family'] = 'sans-serif'
plt.rcParams['font.sans-serif'] =\
    ['Yu Gothic', 'Hiragino Maru Gothic Pro', 'Noto Sans CJK JP']
fig, axs = plt.subplots(
    2, 2,
    figsize=(6, 6),
    tight_layout=True,
)
x = [0, 1, 2, 3]
y = [0, 3, 1, 2]

# タイトル (全体)・軸ラベル(全体)
fig.suptitle('タイトル (全体)')
fig.supxlabel('x軸ラベル(全体)')
fig.supylabel('y軸ラベル(全体)')

# グラフ (0-0)
axs[0, 0].set_title('タイトル (0-0)')
axs[0, 0].plot(x, y)
axs[0, 0].set_xticks(x)
axs[0, 0].set_yticks(y)
axs[0, 0].set_xlabel('x軸ラベル (0-0)')
axs[0, 0].set_ylabel('y軸ラベル (0-0)')
print(axs[0, 0].get_xlabel())
# 出力:x軸ラベル (0-0)
print(axs[0, 0].get_ylabel())
# 出力:y軸ラベル (0-0)

# グラフ (0-1)
axs[0, 1].set_title('タイトル (0-1)')
axs[0, 1].plot(x, y)
axs[0, 1].set_xticks(x)
axs[0, 1].set_yticks(y)
axs[0, 1].set_xlabel(
    'x軸ラベル (0-1)\n[left]',
    fontdict={
        'color': 'red',
        'size': 'large',
    },
    loc='left',
)
axs[0, 1].set_ylabel(
    'y軸ラベル (0-1)\n[bottom]',
    loc='bottom',

    color='red',
    size='large',
)
print(axs[0, 1].get_xlabel())
# 出力:
# x軸ラベル (0-1)
# [left]
print(axs[0, 1].get_ylabel())
# 出力:
# y軸ラベル (0-1)
# [bottom]

# グラフ (1-0)
axs[1, 0].set_title('タイトル (1-0)')
axs[1, 0].plot(x, y)
axs[1, 0].set_xticks(x)
axs[1, 0].set_yticks(y)
axs[1, 0].set_xlabel(
    'x軸ラベル (1-0)\n[center]',
    labelpad=20,
    fontdict={
        'color': 'green',
        'weight': 'bold',
    },
    loc='center',
)
axs[1, 0].set_ylabel(
    'y軸ラベル (1-0)\n[center]',
    labelpad=20,
    loc='center',

    color='green',
    weight='bold',
)
print(axs[1, 0].get_xlabel())
# 出力:
# x軸ラベル (1-0)
# [center]
print(axs[1, 0].get_ylabel())
# 出力:
# y軸ラベル (1-0)
# [center]

# グラフ (1-1)
axs[1, 1].set_title('タイトル (1-1)')
axs[1, 1].plot(x, y)
axs[1, 1].set_xticks(x)
axs[1, 1].set_yticks(y)
axs[1, 1].set_xlabel(
    'x軸ラベル (1-1)\n[right]',
    fontdict={
        'color': 'blue',
    },
    labelpad=-40,
    loc='right',
)
axs[1, 1].set_ylabel(
    'y軸ラベル (1-1)\n[top]',
    labelpad=-40,
    loc='top',

    color='blue',
)
print(axs[1, 1].get_xlabel())
# 出力:
# x軸ラベル (1-1)
# [right]
print(axs[1, 1].get_ylabel())
# 出力:
# y軸ラベル (1-1)
# [top]

# 表示
plt.show()
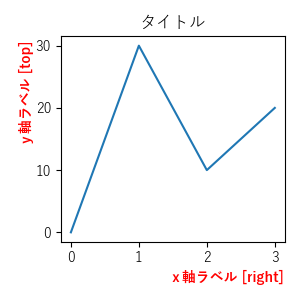
例:pyplot.xlabel【x軸ラベル 設定】・pyplot.ylabel【y軸ラベル 設定】
import matplotlib.pyplot as plt

# 初期設定
plt.rcParams['font.family'] = 'sans-serif'
plt.rcParams['font.sans-serif'] =\
    ['Yu Gothic', 'Hiragino Maru Gothic Pro', 'Noto Sans CJK JP']
plt.figure(
    figsize=(3, 3),
    layout='tight',
)
plt.title('タイトル')

# グラフ
x = [0, 1, 2, 3]
y = [0, 30, 10, 20]
plt.plot(x, y)
plt.xticks(x)
plt.yticks(y)

# 軸ラベル
plt.xlabel(
    'x軸ラベル [right]',
    fontdict={
        'color': 'red',
        'weight': 'bold',
    },
    loc='right',
)
plt.ylabel(
    'y軸ラベル [top]',
    loc='top',

    color='red',
    weight='bold',
)

# 表示
plt.show()