axes.Axes.inset_axes【座標系 挿入】3.03.9
メモ ( 基本 親座標系の拡大 カスタマイズ 関連 外部リンク ) 構文 Axes【座標系】プロパティ・関連メソッド 例 ( 基本 ・親座標系の拡大 ・カスタマイズ )
メモ
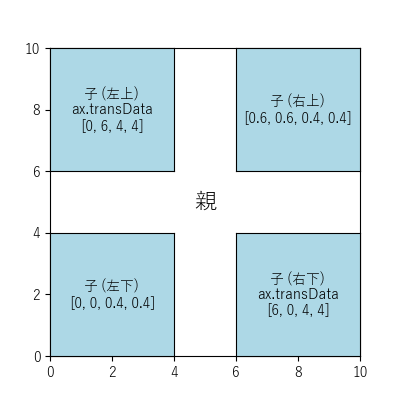
基本
〔 例 〕- matplotlib 3.0 で試験導入、3.9 で正式リリース
- 親座標系内に子座標系を挿入
- 挿入位置・挿入サイズ
- 相対指定:デフォルト (ax.transAxes【座標軸変換】)
- 絶対指定:transform (座標変換)=ax.transData【データポイント変換】
- 複数の挿入可
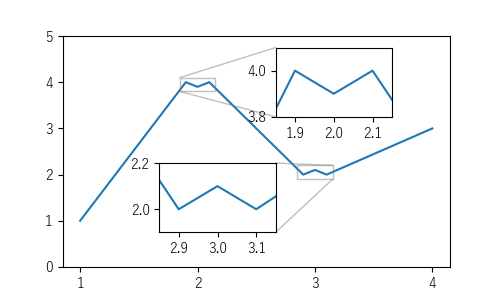
親座標系の拡大
〔 例 〕- 子座標系で親座標系と同じ描画処理
- 拡大部分を子座標系の表示範囲に指定
- 親座標系と子座標系の関連明示
- indicate_inset_zoom【ズームインジケータ長方形追加】3.0
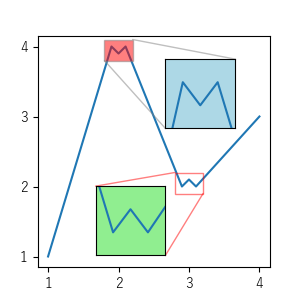
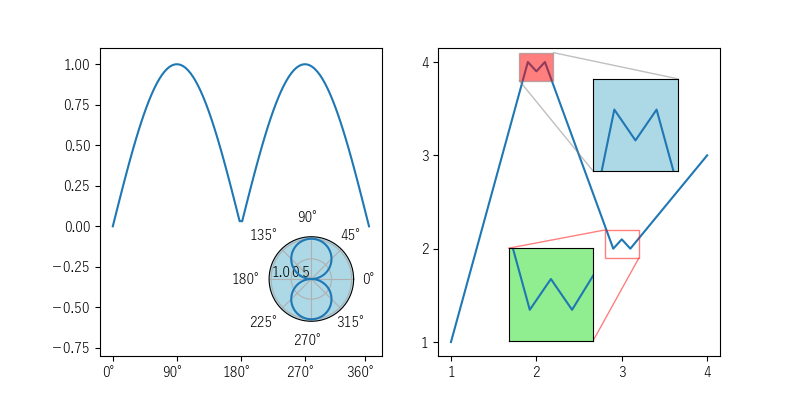
カスタマイズ
〔 例 〕- 各種投影法指定
- Axes【座標系】のカスタマイズ
- 戻り値の Axes【座標系】プロパティ 設定
- inset_axes【座標系 挿入】の引数に Axes【座標系】プロパティ 指定
関連
外部リンク
構文
axes.inset_axes( 3.03.9
    bounds (挿入位置・サイズ),
    *,
    transform (座標変換)=None,
    zorder (Zオーダー)=5,
    **kwargs)

挿入した子 Axes【座標系】(Axes【座標系】プロパティ・関連メソッド参照 )

bounds挿入位置・サイズ ([x0, y0, width, height] 形式 ) transform (座標変換)参照
    x0子座標系の左下x位置 (デフォルト:親座標軸の幅に対する比率 [0 ~ 1])
    y0子座標系の左下y位置 (デフォルト:親座標軸の高さに対する比率 [0 ~ 1])
    width子座標系の幅 (デフォルト:親座標軸の幅に対する比率 [0 ~ 1])
    height子座標系の高さ (デフォルト:親座標軸の高さに対する比率 [0 ~ 1])
以降は キーワード引数
transform (Transform)座標変換
    デフォルト (ax.transAxes【座標軸変換】)bounds (挿入位置・サイズ)は座標軸に対する比率 (0 ~ 1)
    ax.transData【データポイント変換】bounds (挿入位置・サイズ)は座標に対応
    その他
zorderZオーダー (デフォルト:5 = legend【凡例 設定】 / 大きい方が手前)
kwargs可変長キーワード引数
    Axes【座標系】プロパティ
    その他は以下の1つのみ指定可
    axes_classAxes【座標系】のサブクラス 3.6
    polar (bool)極図法の使用有無 (デフォルト:False 未使用) 3.6
    projection (str)投影名 3.6
        None'rectilinear'【直線投影法】
        'aitoff'エイトフ図法
        'hammer'ハンメル図法
        'lambert'ランベルト投影法
        'mollweide'モルワイデ図法
        'polar'極図法
        'rectilinear'直線投影法
Axes【座標系】プロパティ・関連メソッド
- 関連メソッド
- 取得:get_プロパティ名 ( [...] )
- 設定 (個別):set_プロパティ名 ( 設定値 [, ...] )
- 設定 (一括):set( キーワード引数指定 )
(●:定義あり / Artist:親クラスの artist.Artist で定義)
| プロパティ | 型 | デフォルト | get_* | set_* | 備考 |
|---|---|---|---|---|---|
| adjustable | 'box' 'datalim' | ● | ● | 軸調整方法 | |
| agg_filter | callable | Artist | Artist | agg フィルター | |
| alpha | スカラー None | Artist | Artist | アルファ値 (0:透明 ~ 1:不透明) (線とマーカー共有) | |
| anchor | (float, float) str | ● | ● | アンカー | |
| animated | bool | Artist | Artist | アニメーション使用の有無 | |
| aspect | 'auto' 'equal' float | ● | ● | アスペクト比 | |
| autoscale_on | bool | ● | ● | 自動スケーリング | |
| autoscalex_on | bool | ● | ● | 自動スケーリング (x軸) | |
| autoscaley_on | bool | ● | ● | 自動スケーリング (y軸) | |
| axes_locator | callable | ● | ● | ロケータ | |
| axisbelow | bool 'line' | ● | ● | 目盛りとグリッド線の Zオーダー | |
| box_aspect 3.3 | float None | ● | ● | 縦横比 | |
| clip_box | Bbox | Artist | Artist | ||
| clip_on | bool | Artist | Artist | クリッピングの有無 (True:範囲内のみ描画 / False:範囲外にも描画可) | |
| clip_path | Patch (Path, Transform) None | Artist | Artist | ||
| contains 3.5 | callable | ● | Artist | マウスイベント | |
| facecolor fc | color【色定義】 | ● | ● | 背景色 | |
| figure | Figure | Artist | Artist | 所属フィギュア | |
| forward_navigation_events | bool 'auto' | ● | ● | パン/ズーム イベントの下層転送方法 | |
| frame_on | bool | ● | ● | 長方形パッチ描画有無 | |
| gid | str | Artist | Artist | グループId (識別子として利用可) | |
| in_layout | bool | Artist | Artist | レイアウト計算に含めるか否か | |
| label | object | Artist | Artist | 凡例ラベル (アンダースコアで始まるラベルは対象外) | |
| mouseover | bool | Artist | Artist | マウスオーバー時のコンテキスト情報問い合わせ有無 | |
| navigate | bool | ● | ● | ナビゲーション ツールバーコマンド応答有無 | |
| navigate_mode | ● | ● | ナビゲーション ツールバーボタン ステータス | ||
| path_effects | AbstractPathEffect | Artist | Artist | ||
| picker | callable[[Artist, Event], tuple[bool, dict]] float 3.3 | Artist | Artist | callable:ピッカーイベント float:ピッカー有効半径 (参照:contains【ピッカーイベント】3.3 ) | |
| position | [left, bottom, width, height] Bbox | ● | ● | 位置 | |
| prop_cycle | Cycler | ● | プロパティ サイクル | ||
| rasterization_zorder | float None | ● | ● | ラスタライズ Zオーダー しきい値 | |
| rasterized | bool | Artist | Artist | ラスタライズ(ビットマップ) 描画の強制有無 | |
| sketch_params | (float, float, float) | Artist | Artist | ||
| snap | bool None | Artist | Artist | スナップ (ピクセル位置補正) の有無 (Agg・MacOSX バックエンドのみサポート) | |
| subplotspec 3.7 | ● | ● | サブプロット詳細 | ||
| title | str | ● | ● | タイトル | |
| transform | matplotlib.transforms.Transform | Artist | Artist | 座標変換 | |
| url | str | Artist | Artist | ハイパーリンクURL (SVG のみ対応) | |
| visible | bool | Artist | Artist | 表示有無 | |
| xbound | (float, float) | ● | ● | 下限・上限 (x軸) | |
| xlabel | str | ● | ● | ラベル (x軸) | |
| xlim | (float, float) | ● | ● | 表示範囲 (x軸) | |
| xmargin | float | ● | ● | マージン (x軸) | |
| xscale | str | ● | ● | スケール (x軸) | |
| xticklabels 3.7 | list[ str ] | ● | ● | 目盛りラベル (x軸) | |
| xticks | float | ● | ● | 目盛り位置・ラベル (x軸) | |
| ybound | (float, float) | ● | ● | 下限・上限 (y軸) | |
| ylabel | str | ● | ● | ラベル (y軸) | |
| ylim | (float, float) | ● | ● | 表示範囲 (y軸) | |
| ymargin | float | ● | ● | マージン (y軸) | |
| yscale | str | ● | ● | スケール (y軸) | |
| yticklabels 3.7 | list[ str ] | ● | ● | 目盛りラベル (y軸) | |
| yticks | float | ● | ● | 目盛り位置・ラベル (y軸) | |
| zorder | float | Artist | Artist | Zオーダー (大きい方が手前) |
例
基本
import matplotlib.pyplot as plt

# 初期設定
plt.rcParams['font.family'] = 'sans-serif'
plt.rcParams['font.sans-serif'] = \
    ['Yu Gothic', 'Hiragino Maru Gothic Pro', 'Noto Sans CJK JP']
fig, ax = plt.subplots(
    figsize=(4, 4),
)

# 親
ax.set_xlim(0, 10)
ax.set_ylim(0, 10)
ax.text(
    5, 5,
    '親',
    fontsize=16,
    horizontalalignment='center',
    verticalalignment='center',
)

# 子 (左上)
axins_1 = ax.inset_axes(
    [0, 6, 4, 4],
    transform=ax.transData,
)
axins_1.set_xlim(0, 1)
axins_1.set_ylim(0, 1)
axins_1.set_xticks([])
axins_1.set_yticks([])
axins_1.set_facecolor('lightblue')
axins_1.text(
    0.5, 0.5,
    '子 (左上)\nax.transData\n[0, 6, 4, 4]',
    horizontalalignment='center',
    verticalalignment='center',
)

# 子 (右上)
axins_2 = ax.inset_axes(
    [0.6, 0.6, 0.4, 0.4],
)
axins_2.set_xlim(0, 10)
axins_2.set_ylim(0, 10)
axins_2.set_xticks([])
axins_2.set_yticks([])
axins_2.set_facecolor('lightblue')
axins_2.text(
    5, 5,
    '子 (右上)\n[0.6, 0.6, 0.4, 0.4]',
    horizontalalignment='center',
    verticalalignment='center',
)

# 子 (左下)
axins_3 = ax.inset_axes(
    [0, 0, 0.4, 0.4],
)
axins_3.set_xlim(0, 100)
axins_3.set_ylim(0, 100)
axins_3.set_xticks([])
axins_3.set_yticks([])
axins_3.set_facecolor('lightblue')
axins_3.text(
    50, 50,
    '子 (左下)\n[0, 0, 0.4, 0.4]',
    horizontalalignment='center',
    verticalalignment='center',
)

# 子 (右下)
axins_4 = ax.inset_axes(
    [6, 0, 4, 4],
    transform=ax.transData,
)
axins_4.set_xlim(0, 1000)
axins_4.set_ylim(0, 1000)
axins_4.set_xticks([])
axins_4.set_yticks([])
axins_4.set_facecolor('lightblue')
axins_4.text(
    500, 500,
    '子 (右下)\nax.transData\n[6, 0, 4, 4]',
    horizontalalignment='center',
    verticalalignment='center',
)

plt.show()
親座標系の拡大
import matplotlib.pyplot as plt

# 初期設定
plt.rcParams['font.family'] = 'sans-serif'
plt.rcParams['font.sans-serif'] = \
    ['Yu Gothic', 'Hiragino Maru Gothic Pro', 'Noto Sans CJK JP']
fig, ax = plt.subplots(
    figsize=(5, 3),
)

# データ
x = [1, 1.9, 2, 2.1, 2.9, 3, 3.1, 4]
y = [1, 4, 3.9, 4, 2, 2.1, 2, 3]

# グラフ
ax.plot(x, y)
ax.set_xticks([1, 2, 3, 4])
ax.set_yticks([0, 1, 2, 3, 4, 5])

# ズーム1
axins_a = ax.inset_axes(
    [0.55, 0.65, 0.3, 0.3]
)
axins_a.plot(x, y)
axins_a.set_xlim(1.85, 2.15)
axins_a.set_ylim(3.8, 4.1)
ax.indicate_inset_zoom(axins_a)

# ズーム2
axins_b = ax.inset_axes(
    [0.25, 0.15, 0.3, 0.3],
)
axins_b.plot(x, y)
axins_b.set_xlim(2.85, 3.15)
axins_b.set_ylim(1.9, 2.2)
ax.indicate_inset_zoom(axins_b)

plt.show()
カスタマイズ
import matplotlib.pyplot as plt
import numpy as np

# 初期設定
plt.rcParams['font.family'] = 'sans-serif'
plt.rcParams['font.sans-serif'] = \
    ['Yu Gothic', 'Hiragino Maru Gothic Pro', 'Noto Sans CJK JP']
fig, axs = plt.subplots(
    1,
    2,
    figsize=(8, 4),
)

# データ (0)
theta = np.linspace(0, 2 * np.pi, 100)
r = np.abs(np.sin(theta))
# グラフ (0)
axs[0].plot(theta, r)
axs[0].set_xticks(
    [0, 1.57, 3.14, 4.71, 6.18],
    ['0°', '90°', '180°', '270°', '360°'],
)
axs[0].set_ylim(-0.8, 1.1)
# ズーム
axins_p = axs[0].inset_axes(
    [0.6, 0.1, 0.3, 0.3],
    projection='polar',
)
axins_p.plot(theta, r)
axins_p.set_rlabel_position(180)
axins_p.set_facecolor('lightblue')

# データ (1)
x = [1, 1.9, 2, 2.1, 2.9, 3, 3.1, 4]
y = [1, 4, 3.9, 4, 2, 2.1, 2, 3]
# グラフ (1)
axs[1].plot(x, y)
axs[1].set_yticks([1, 2, 3, 4])
# ズーム1
axins_a = axs[1].inset_axes(
    [0.55, 0.6, 0.3, 0.3]
)
axins_a.plot(x, y)
axins_a.set_xlim(1.8, 2.2)
axins_a.set_ylim(3.8, 4.1)
axins_a.set_xticks([])
axins_a.set_yticks([])
axins_a.set_facecolor('lightblue')
axs[1].indicate_inset_zoom(axins_a, facecolor='red')
# ズーム2 (各種引数指定)
axins_b = axs[1].inset_axes(
    [0.25, 0.05, 0.3, 0.3],
    xticks=[],
    yticks=[],
    xlim=(2.8, 3.2),
    ylim=(1.9, 2.2),
    facecolor='lightgreen',
)
axins_b.plot(x, y)
axs[1].indicate_inset_zoom(axins_b, edgecolor='red')

plt.show()