各種目盛りフォーマッタ
関連: 目盛りフォーマット設定・取得
メモ
各種目盛りフォーマッタ 一覧
| クラス | |
|---|---|
| ticker. | Formatter【フォーマッタ (基本)】 |
| EngFormatter【フォーマッタ (工学)】3.1 / 3.83.10 | |
| FixedFormatter【フォーマッタ (固定)】 | |
| FormatStrFormatter【フォーマッタ (旧フォーマット文字列)】 | |
| FuncFormatter【フォーマッタ (ユーザー定義関数)】 | |
| IndexDateFormatter 3.33.5 | |
| IndexFormatter 3.33.5 | |
| LogFormatter【対数フォーマッタ (基本)】 | |
| LogFormatterExponent【対数フォーマッタ (指数)】 | |
| LogFormatterMathtext | |
| LogFormatterSciNotation | |
| LogitFormatter | |
| NullFormatter【フォーマッタ (ヌル)】 | |
| OldScalarFormatter 3.33.5 | |
| PercentFormatter【フォーマッタ (パーセント)】 | |
| ScalarFormatter【フォーマッタ (スカラー)】3.1 / 3.3 / 3.43.10 | |
| StrMethodFormatter【フォーマッタ (新フォーマット文字列)】3.9 | |
| dates. | AutoDateFormatter【日付フォーマッタ (自動)】 |
| ConciseDateFormatter【日付フォーマッタ (簡潔)】3.1 | |
| DateFormatter【日付フォーマッタ】 | |
| category. | StrCategoryFormatter |
関連
外部リンク
Formatter【フォーマッタ (基本)】
メモ
- 各種フォーマッタの親クラス
関連
外部リンク
構文
class matplotlib.ticker.Formatter( )
| 属性 | 備考 |
|---|---|
| locs | (デフォルト:[ ]) |
| メソッド | 備考 |
| __call__(x, pos=None) | 継承クラスでオーバーライド |
| static fix_minus(s) | |
| format_data(value) | |
| format_data_short(value) | |
| format_ticks(values) 3.1 | |
| get_offset() | |
| set_locs(locs) |
EngFormatter【フォーマッタ (工学)】3.1 / 3.83.10
メモ
- 工学フォーマッタ
- ScalarFormatter【フォーマッタ (スカラー)】を継承
- 1000 の累乗をプレフィックスと単位で表現 (ENG_PREFIXES 定義)
10N プレフィックス 10N プレフィックス 30 'Q' 3.8 -30 'q' 3.8 27 'R' 3.8 -27 'r' 3.8 24 'Y' -24 'y' 21 'Z' -21 'z' 18 'E' -18 'a' 15 'P' -15 'f' 12 'T' -12 'p' 9 'G' -9 'n' 6 'M' -6 'µ' 3 'k' -3 'm' 0 '' - オフセット表記の指定可 3.10
- オフセットテキストは axis.Axis.offsetText で参照
関連
外部リンク
構文
親クラス:ScalarFormatter【フォーマッタ (スカラー)】
class matplotlib.ticker.EngFormatter(
    unit='',
    places=None,
    sep=' ',
    * 3.1,
    usetex3.1 =None,
    useMathText3.1 =None,
    useOffset3.10 =False)


unit (str)単位記号 ('Hz'・'m' 等)
places (int)小数点以下の桁数 (1 ~ 3 / 省略:0~5 自動)
sep (str)値と単位の間のセパレータ (以下の指定も可)
    ' 'スペース (デフォルト)
    '' (空文字列)セパレータなし
    '\N{THIN SPACE}'細いスペース (U+2009)
    '\N{NARROW NO-BREAK SPACE}'細い改行なしスペース (U+202F)
    '\N{NO-BREAK SPACE}'改行なしスペース (U+00A0)
以下キーワード引数 3.1
usetex (bool)3.1TeX 数学モードの使用有無 (デフォルト:False rcParams["text.usetex"])
useMathText (bool)3.1数学フォーマットの使用有無 (デフォルト:False rcParams["axes.formatter.use_mathtext"])
useOffset (bool | float)3.10オフセット表記の使用有無、またはオフセット値 (デフォルト:False)
| 属性 | メソッド | 備考 |
|---|---|---|
| ENG_PREFIXES | プレフィックス (メモ 参照) | |
| useMathText | get_useMathText( ) set_useMathText(val) | 数学フォーマットの使用有無 |
| useOffset 3.10 | get_useOffset( ) set_useOffset(val) | オフセット表記の使用有無・オフセット値 |
| usetex | get_usetex( ) set_usetex(val) | TeX 数学モードの使用有無 |
| format_data(num) format_eng(num) (エイリアス) | 数値フォーマット | |
| set_locs(locs) | ||
| get_offset( ) |
例 (1/2)
import matplotlib.ticker as ptick

# プレフィックス
print(ptick.EngFormatter.ENG_PREFIXES)
# 出力:
# {-30: 'q', -27: 'r', ~ , -3: 'm', 0: '', 3: 'k', ~ , 27: 'R', 30: 'Q'}

# メソッド
formatter = ptick.EngFormatter(places=2)
print(formatter.format_data(1234))
# 出力:1.23 k
print(formatter.format_eng(12345))
# 出力:12.35 k
print(formatter.format_data(123456))
# 出力:123.46 k
print(formatter.format_eng(1234567))
# 出力:1.23 M
例 (2/2)

import matplotlib.pyplot as plt
import matplotlib.ticker as ptick

# 初期設定
plt.rcParams['font.family'] = 'sans-serif'
plt.rcParams['font.sans-serif'] =\
    ['Yu Gothic', 'Hiragino Maru Gothic Pro', 'Noto Sans CJK JP']
fig, axs = plt.subplots(
    1, 2,
    figsize=(8, 4),
    tight_layout=True,
)
plt.suptitle('EngFormatter【フォーマッタ (工学)】')
x = [0, 1000, 2000, 3000]
y = [0, 3_000_000, 1_000_000, 2_000_000]

# グラフ [0]
axs[0].set_title('補助目盛り指定 (両軸)')
axs[0].plot(x, y)
axs[0].set_xticks(x)
axs[0].set_xticks([500, 1500, 2500], minor=True)
axs[0].xaxis.set_major_formatter(ptick.EngFormatter('m'))
axs[0].xaxis.set_minor_formatter(ptick.EngFormatter('\n(m)', sep=''))
axs[0].set_yticks(y)
axs[0].set_yticks([500_000, 1_500_000, 2_500_000], minor=True)
axs[0].yaxis.set_major_formatter(ptick.EngFormatter('Hz'))
axs[0].yaxis.set_minor_formatter(ptick.EngFormatter('(Hz)', sep=''))

# グラフ [1]
axs[1].set_title('オフセット指定 (両軸)')
axs[1].plot(x, y)
axs[1].set_xticks(x)
axs[1].xaxis.set_major_formatter(
    ptick.EngFormatter('m', useOffset=500)
)
axs[1].xaxis.offsetText.set_color('red')
axs[1].set_yticks(y)
axs[1].yaxis.set_major_formatter(
    ptick.EngFormatter('Hz', useOffset=500_000)
)
axs[1].yaxis.offsetText.set_color('red')

# 表示
plt.show()
FixedFormatter【フォーマッタ (固定)】
メモ
- 固定フォーマッタ
- ticker.FixedLocator の使用が必要
関連
外部リンク
構文
class matplotlib.ticker.FixedFormatter(seq)

seqラベル文字列のシーケンス
| メソッド | 備考 |
|---|---|
| get_offset() | |
| set_offset_string(ofs) |
例

import matplotlib.pyplot as plt
import matplotlib.ticker as ptick

# 初期設定
plt.rcParams['font.family'] = 'sans-serif'
plt.rcParams['font.sans-serif'] =\
    ['Yu Gothic', 'Hiragino Maru Gothic Pro', 'Noto Sans CJK JP']
fig, ax = plt.subplots(
    1, 1,
    figsize=(4, 3),
    tight_layout=True,
)
x = [0, 1, 2, 3]
y = [0, 3, 1, 2]

# グラフ
ax.set_title('FixedFormatter【フォーマッタ (固定)】')
ax.plot(x, y)
ax.xaxis.set_major_locator(ptick.FixedLocator([0, 1, 2, 3]))
ax.xaxis.set_minor_locator(ptick.FixedLocator([0.5, 1.5, 2.5]))
ax.xaxis.set_major_formatter(ptick.FixedFormatter(['X0', 'X1', 'X2', 'X3']))
ax.xaxis.set_minor_formatter(ptick.FixedFormatter(['xa', 'xb', 'xc']))
ax.yaxis.set_major_locator(ptick.FixedLocator([0, 1, 2, 3]))
ax.yaxis.set_minor_locator(ptick.FixedLocator([0.5, 1.5, 2.5]))
ax.yaxis.set_major_formatter(ptick.FixedFormatter(['Y0', 'Y1', 'Y2', 'Y3']))
ax.yaxis.set_minor_formatter(ptick.FixedFormatter(['ya', 'yb', 'yc']))

# 表示
plt.show()
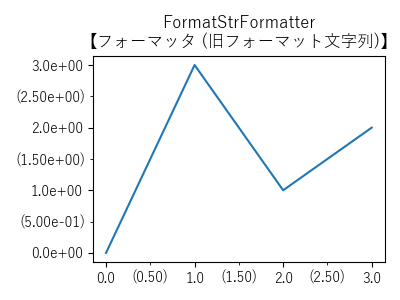
FormatStrFormatter【フォーマッタ (旧フォーマット文字列)】
メモ
- 旧フォーマット文字列指定のフォーマッタ
関連
外部リンク
構文
class matplotlib.ticker.FormatStrFormatter(fmt)

fmtフォーマット文字列 (旧スタイル:値に対して % 使用)
例
import matplotlib.pyplot as plt
import matplotlib.ticker as ptick

# 初期設定
plt.rcParams['font.family'] = 'sans-serif'
plt.rcParams['font.sans-serif'] =\
    ['Yu Gothic', 'Hiragino Maru Gothic Pro', 'Noto Sans CJK JP']
fig, ax = plt.subplots(
    1, 1,
    figsize=(4, 3),
    tight_layout=True,
)
x = [0, 1, 2, 3]
y = [0, 3, 1, 2]

# グラフ
ax.set_title('FormatStrFormatter\n【フォーマッタ (旧フォーマット文字列)】')
ax.plot(x, y)
ax.set_xticks(x)
ax.set_xticks([0.5, 1.5, 2.5], minor=True)
ax.xaxis.set_major_formatter(ptick.FormatStrFormatter('%.1f'))
ax.xaxis.set_minor_formatter(ptick.FormatStrFormatter('(%.2f)'))
ax.set_yticks(y)
ax.set_yticks([0.5, 1.5, 2.5], minor=True)
ax.yaxis.set_major_formatter(ptick.FormatStrFormatter('%.1e'))
ax.yaxis.set_minor_formatter(ptick.FormatStrFormatter('(%.2e)'))

# 表示
plt.show()
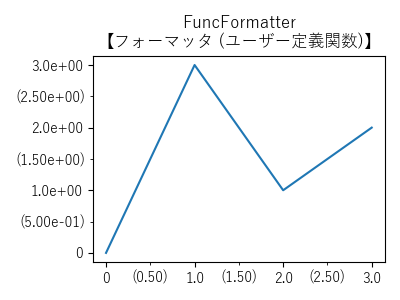
FuncFormatter【フォーマッタ (ユーザー定義関数)】
メモ
- ユーザー定義関数指定のフォーマッタ
関連
外部リンク
構文
class matplotlib.ticker.FuncFormatter(func)

funcユーザー定義関数 (下記参照)
| 引数 | 備考 |
|---|---|
| x | 目盛り値 |
| pos | 位置 |
| 戻り値 | |
| 目盛りラベル | |
| メソッド | 備考 |
|---|---|
| get_offset() | |
| set_offset_string(ofs) |
例
import matplotlib.pyplot as plt
import matplotlib.ticker as ptick

def x_major_formatter(x, pos):
    if x == 0:
        label = '0'
    else:
        label = f'{x:.1f}'
    return label

def x_minor_formatter(x, pos):
    label = f'({x:.2f})'
    return label

def y_major_formatter(y, pos):
    if y == 0:
        label = '0'
    else:
        label = f'{y:.1e}'
    return label

def y_minor_formatter(y, pos):
    label = f'({y:.2e})'
    return label


# 初期設定
plt.rcParams['font.family'] = 'sans-serif'
plt.rcParams['font.sans-serif'] =\
    ['Yu Gothic', 'Hiragino Maru Gothic Pro', 'Noto Sans CJK JP']
fig, ax = plt.subplots(
    1, 1,
    figsize=(4, 3),
    tight_layout=True,
)
x = [0, 1, 2, 3]
y = [0, 3, 1, 2]

# グラフ
ax.set_title('FuncFormatter\n【フォーマッタ (ユーザー定義関数)】')
ax.plot(x, y)
ax.set_xticks(x)
ax.set_xticks([0.5, 1.5, 2.5], minor=True)
ax.xaxis.set_major_formatter(ptick.FuncFormatter(x_major_formatter))
ax.xaxis.set_minor_formatter(ptick.FuncFormatter(x_minor_formatter))
ax.set_yticks(y)
ax.set_yticks([0.5, 1.5, 2.5], minor=True)
ax.yaxis.set_major_formatter(ptick.FuncFormatter(y_major_formatter))
ax.yaxis.set_minor_formatter(ptick.FuncFormatter(y_minor_formatter))

# 表示
plt.show()
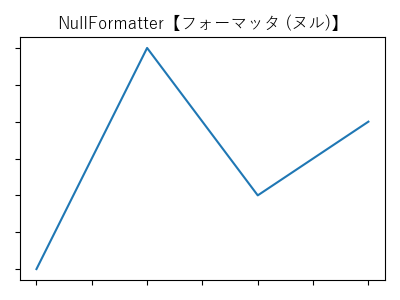
NullFormatter【フォーマッタ (ヌル)】
メモ
- ヌルフォーマッタ
- 空文字列を返却する為、目盛りなし
関連
外部リンク
構文
class matplotlib.ticker.NullFormatter( )
例
import matplotlib.pyplot as plt
import matplotlib.ticker as ptick

# 初期設定
plt.rcParams['font.family'] = 'sans-serif'
plt.rcParams['font.sans-serif'] =\
    ['Yu Gothic', 'Hiragino Maru Gothic Pro', 'Noto Sans CJK JP']
fig, ax = plt.subplots(
    1, 1,
    figsize=(4, 3),
    tight_layout=True,
)
x = [0, 1, 2, 3]
y = [0, 3, 1, 2]

# グラフ
ax.set_title('NullFormatter【フォーマッタ (ヌル)】')
ax.plot(x, y)
ax.xaxis.set_major_formatter(ptick.NullFormatter())
ax.yaxis.set_major_formatter(ptick.NullFormatter())

# 表示
plt.show()
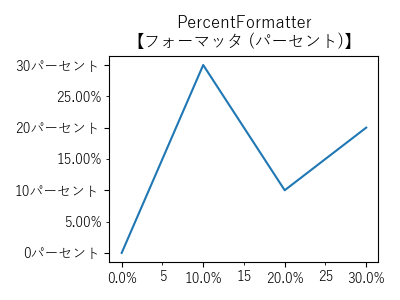
PercentFormatter【フォーマッタ (パーセント)】
メモ
- パーセント フォーマッタ
- パーセンテージ (%) で表現
関連
外部リンク
構文
class matplotlib.ticker.PercentFormatter(xmax=100, decimals=None, symbol='%', is_latex=False)

xmax (float)100% に対応するデータ値
decimals (None | int)小数点以下の桁数 (省略:自動設定)
symbol (str | None)パーセンテージのシンボル
is_latex (bool)LaTeXの使用有無 (rcParams["text.usetex"] False:symbol (シンボル)内のLaTeX予約文字をエスケープ)
| 属性 | 備考 |
|---|---|
| symbol | |
| メソッド | 備考 |
| convert_to_pct(x) | |
| format_pct(x, display_range) |
例
import matplotlib.pyplot as plt
import matplotlib.ticker as ptick

# 初期設定
plt.rcParams['font.family'] = 'sans-serif'
plt.rcParams['font.sans-serif'] =\
    ['Yu Gothic', 'Hiragino Maru Gothic Pro', 'Noto Sans CJK JP']
fig, ax = plt.subplots(
    1, 1,
    figsize=(4, 3),
    tight_layout=True,
)
x = [0, 1, 2, 3]
y = [0, 3, 1, 2]

# グラフ
ax.set_title('PercentFormatter\n【フォーマッタ (パーセント)】')
ax.plot(x, y)
ax.set_xticks(x)
ax.set_xticks([0.5, 1.5, 2.5], minor=True)
ax.xaxis.set_major_formatter(ptick.PercentFormatter(xmax=10))
ax.xaxis.set_minor_formatter(ptick.PercentFormatter(xmax=10, decimals=0, symbol=''))
ax.set_yticks(y)
ax.set_yticks([0.5, 1.5, 2.5], minor=True)
ax.yaxis.set_major_formatter(ptick.PercentFormatter(xmax=10, decimals=0, symbol='パーセント'))
ax.yaxis.set_minor_formatter(ptick.PercentFormatter(xmax=10, decimals=2))

# 表示
plt.show()
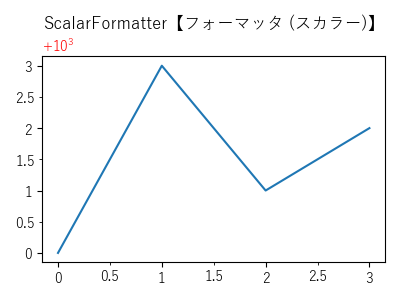
ScalarFormatter【フォーマッタ (スカラー)】3.1 / 3.3 / 3.43.10
メモ
- スカラー フォーマッタ
- デフォルトのフォーマッタ
- オフセット表記の指定可
- オフセットテキストは axis.Axis.offsetText で参照
関連
外部リンク
構文
class matplotlib.ticker.ScalarFormatter(
    useOffset=None,
    useMathText=None,
    useLocale=None,
    * 3.10,
    usetex3.10 =None)

useOffset (bool | float)オフセット表記の使用有無、またはオフセット値 (省略:True rcParams["axes.formatter.useoffset"])
useMathText (bool)数学フォーマットの使用有無
    True:10N 形式
    False:1eN 形式 (デフォルト:rcParams["axes.formatter.use_mathtext"])
useLocale (bool)ロケール設定の使用有無 (省略:False rcParams["axes.formatter.use_locale"])
以下キーワード引数 3.10
usetex (bool)3.10TeX 数学モードの使用有無 (デフォルト:False rcParams["text.usetex"])
| 属性 | メソッド | 備考 |
|---|---|---|
| useLocale | get_useLocale() set_useLocale(val) | ロケール設定の使用有無 |
| useMathText | get_useMathText() set_useMathText(val) | 数学フォーマットの使用有無 |
| useOffset | get_useOffset() set_useOffset(val) | オフセットの使用有無・オフセット値 |
| usetex 3.10 | get_usetex 3.10 set_usetex(val) 3.10 | TeX 数学モードの使用有無 |
| format_data(value) | 数値フォーマット | |
| format_data_short(value) | 数値フォーマット (短い) | |
| set_locs(locs) | ||
| get_offset() | ||
| set_powerlimits(lims) | ||
| pprint_val() 3.13.3 | ||
| set_scientific(b) |
例
import matplotlib.pyplot as plt
import matplotlib.ticker as ptick

# 初期設定
plt.rcParams['font.family'] = 'sans-serif'
plt.rcParams['font.sans-serif'] =\
    ['Yu Gothic', 'Hiragino Maru Gothic Pro', 'Noto Sans CJK JP']
fig, ax = plt.subplots(
    1, 1,
    figsize=(4, 3),
    tight_layout=True,
)
x = [0, 1, 2, 3]
y = [1000, 1003, 1001, 1002]

# グラフ
ax.set_title('ScalarFormatter【フォーマッタ (スカラー)】')
ax.plot(x, y)
ax.set_xticks(x)
ax.set_xticks([0.5, 1.5, 2.5], minor=True)
ax.xaxis.set_major_formatter(ptick.ScalarFormatter())
ax.xaxis.set_minor_formatter(ptick.ScalarFormatter())
ax.set_yticks(y)
ax.set_yticks([1000.5, 1001.5, 1002.5], minor=True)
ax.yaxis.set_major_formatter(ptick.ScalarFormatter(useOffset=1000, useMathText=True))
ax.yaxis.set_minor_formatter(ptick.ScalarFormatter(useOffset=1000, useMathText=True))
ax.yaxis.offsetText.set_color('red')

# 表示
plt.show()
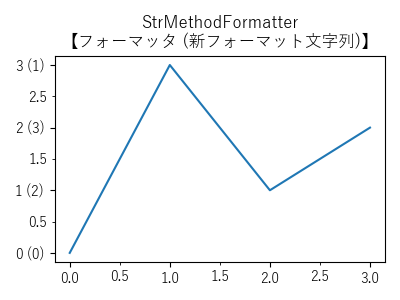
StrMethodFormatter【フォーマッタ (新フォーマット文字列)】3.9
メモ
- 新フォーマット文字列指定のフォーマッタ
- マイナス記号 3.9
- − (U+2212:Minus Sign):rcParams["axes.unicode_minus"] = True (デフォルト)
- - (U+002D:Hyphen-Minus):rcParams["axes.unicode_minus"] = False
関連
外部リンク
構文
class matplotlib.ticker.StrMethodFormatter(fmt)

fmtフォーマット文字列 (新スタイル:str.format 形式)
    x:値 (y軸もx使用)
    pos:目盛り位置
例
import matplotlib.pyplot as plt
import matplotlib.ticker as ptick

# 初期設定
plt.rcParams['font.family'] = 'sans-serif'
plt.rcParams['font.sans-serif'] =\
    ['Yu Gothic', 'Hiragino Maru Gothic Pro', 'Noto Sans CJK JP']
fig, ax = plt.subplots(
    1, 1,
    figsize=(4, 3),
    tight_layout=True,
)
x = [0, 1, 2, 3]
y = [0, 3, 1, 2]

# グラフ
ax.set_title('StrMethodFormatter\n【フォーマッタ (新フォーマット文字列)】')
ax.plot(x, y)
ax.set_xticks(x)
ax.set_xticks([0.5, 1.5, 2.5], minor=True)
ax.xaxis.set_major_formatter(ptick.StrMethodFormatter('{x:.1f}'))
ax.xaxis.set_minor_formatter(ptick.StrMethodFormatter('{x}'))
ax.set_yticks(y)
ax.set_yticks([0.5, 1.5, 2.5], minor=True)
ax.yaxis.set_major_formatter(ptick.StrMethodFormatter('{x} ({pos})'))
ax.yaxis.set_minor_formatter(ptick.StrMethodFormatter('{x}'))

# 表示
plt.show()