import matplotlib.pyplot as plt

# 初期設定
plt.rcParams['font.family'] = 'sans-serif'
plt.rcParams['font.sans-serif'] = \
    ['Yu Gothic', 'Hiragino Maru Gothic Pro', 'Noto Sans CJK JP']
fig, axs = plt.subplots(
    2, 3,
figsize=(9, 6),
tight_layout=True,
)
x0 = [0, 1, 2, 3]
y0 = [0, 3, 1, 2]
x1 = [0.5, 1.5, 2.5]
y1 = [0.5, 1.5, 2.5]

# グラフ (0, 0)
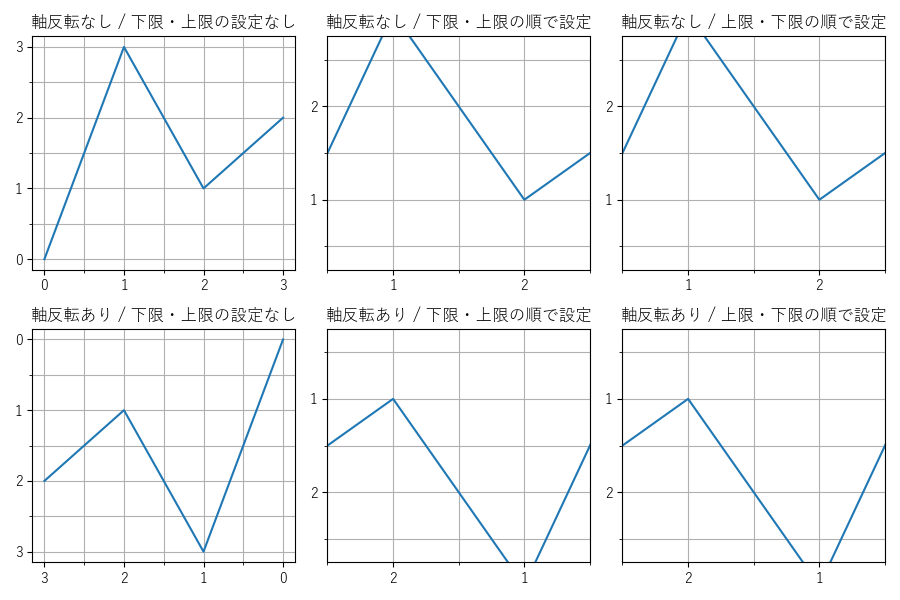
axs[0, 0].set_title('軸反転なし / 下限・上限の設定なし')
axs[0, 0].plot(x0, y0)
# 目盛り設定
axs[0, 0].set_xticks(x0)
axs[0, 0].set_xticks(x1, minor=True)
axs[0, 0].set_yticks(y0)
axs[0, 0].set_yticks(y1, minor=True)
# グリッド
axs[0, 0].grid()
axs[0, 0].grid(which = 'minor')
# データ上限・下限 取得
print(axs[0, 0].get_xbound())
# 出力:(-0.15000000000000002, 3.15)
print(axs[0, 0].get_ybound())
# 出力:(-0.15000000000000002, 3.15)

# グラフ (0, 1)
axs[0, 1].set_title('軸反転なし / 下限・上限の順で設定')
axs[0, 1].plot(x0, y0)
# 目盛り設定
axs[0, 1].set_xticks(x0)
axs[0, 1].set_xticks(x1, minor=True)
axs[0, 1].set_yticks(y0)
axs[0, 1].set_yticks(y1, minor=True)
# グリッド
axs[0, 1].grid()
axs[0, 1].grid(which = 'minor')
# データ上限・下限 設定
axs[0, 1].set_xbound(0.5, 2.5)
axs[0, 1].set_ybound(0.25, 2.75)
# データ上限・下限 取得
print(axs[0, 1].get_xbound())
# 出力:(0.5, 2.5)
print(axs[0, 1].get_ybound())
# 出力:(0.25, 2.75)

# グラフ (0, 2)
axs[0, 2].set_title('軸反転なし / 上限・下限の順で設定')
axs[0, 2].plot(x0, y0)
# 目盛り設定
axs[0, 2].set_xticks(x0)
axs[0, 2].set_xticks(x1, minor=True)
axs[0, 2].set_yticks(y0)
axs[0, 2].set_yticks(y1, minor=True)
# グリッド
axs[0, 2].grid()
axs[0, 2].grid(which = 'minor')
# データ上限・下限 設定
axs[0, 2].set_xbound(2.5, 0.5)
axs[0, 2].set_ybound(2.75, 0.25)
# データ上限・下限 取得
print(axs[0, 2].get_xbound())
# 出力:(0.5, 2.5)
print(axs[0, 2].get_ybound())
# 出力:(0.25, 2.75)

# グラフ (1, 0)
axs[1, 0].set_title('軸反転あり / 下限・上限の設定なし')
axs[1, 0].plot(x0, y0)
# 目盛り設定
axs[1, 0].set_xticks(x0)
axs[1, 0].set_xticks(x1, minor=True)
axs[1, 0].set_yticks(y0)
axs[1, 0].set_yticks(y1, minor=True)
# グリッド
axs[1, 0].grid()
axs[1, 0].grid(which = 'minor')
# 軸反転
axs[1, 0].invert_xaxis()
axs[1, 0].invert_yaxis()
# データ上限・下限 取得
print(axs[1, 0].get_xbound())
# 出力:(-0.15000000000000002, 3.15)
print(axs[1, 0].get_ybound())
# 出力:(-0.15000000000000002, 3.15)

# グラフ (1, 1)
axs[1, 1].set_title('軸反転あり / 下限・上限の順で設定')
axs[1, 1].plot(x0, y0)
# 目盛り設定
axs[1, 1].set_xticks(x0)
axs[1, 1].set_xticks(x1, minor=True)
axs[1, 1].set_yticks(y0)
axs[1, 1].set_yticks(y1, minor=True)
# グリッド
axs[1, 1].grid()
axs[1, 1].grid(which = 'minor')
# 軸反転
axs[1, 1].invert_xaxis()
axs[1, 1].invert_yaxis()
# データ上限・下限 設定
axs[1, 1].set_xbound(0.5, 2.5)
axs[1, 1].set_ybound(0.25, 2.75)
# データ上限・下限 取得
print(axs[1, 1].get_xbound())
# 出力:(0.5, 2.5)
print(axs[1, 1].get_ybound())
# 出力:(0.25, 2.75)

# グラフ (1, 2)
axs[1, 2].set_title('軸反転あり / 上限・下限の順で設定')
axs[1, 2].plot(x0, y0)
axs[1, 2].set_xticks(x0)
# 目盛り設定
axs[1, 2].set_xticks(x1, minor=True)
axs[1, 2].set_yticks(y0)
axs[1, 2].set_yticks(y1, minor=True)
# グリッド
axs[1, 2].grid()
axs[1, 2].grid(which = 'minor')
# 軸反転
axs[1, 2].invert_xaxis()
axs[1, 2].invert_yaxis()
# データ上限・下限 設定
axs[1, 2].set_xbound(2.5, 0.5)
axs[1, 2].set_ybound(2.75, 0.25)
# データ上限・下限 取得
print(axs[1, 2].get_xbound())
# 出力:(0.5, 2.5)
print(axs[1, 2].get_ybound())
# 出力:(0.25, 2.75)

# 表示
plt.show()

