表示範囲の取得・設定
set_xlim・set_ylim【x・y軸表示範囲 設定】3.1 / 3.6
get_xlim・get_ylim【x・y軸表示範囲 取得】
pyplot.xlim・pyplot.ylim【x・y軸表示範囲 取得・設定】
axis・pyplot.axis【表示範囲等 取得・設定】3.1 ~ 3.4 / 3.7
axes.Axes.set_xlim【x軸表示範囲 設定】3.1 / 3.6
axes.Axes.get_xlim【x軸表示範囲 取得】
axes.Axes.set_ylim【y軸表示範囲 設定】3.1 / 3.6
axes.Axes.get_ylim【y軸表示範囲 取得】
メモ
- 軸の表示範囲の取得と設定
- 設定で上限と下限が一致している場合、範囲を拡張 3.1
関連
外部リンク
構文
axes.set_xlim(
    left (x軸表示範囲の左座標)=None,
    right (x軸表示範囲の右座標)=None,
    *, 3.6 推奨
    emit (変更通知有無)=True,
    auto (軸の自動スケーリング有無)=False,
    *, 3.6 非推奨
    xmin (x軸表示範囲の最小座標)3.03.1 非推奨 取り消し =None,
    xmax (x軸表示範囲の最大座標)3.03.1 非推奨 取り消し =None)

戻り値x軸の表示範囲
    (left (float:x軸表示範囲の左座標), right (float:x軸表示範囲の右座標))の tuple【タプル】

left (float)x軸表示範囲の左座標 (None:変更なし)
    (left, right)の tuple【タプル】も指定可
right (float)x軸表示範囲の右座標 (None:変更なし)
以下、キーワード引数 3.6 推奨
emit (bool)変更通知有無
auto (bool | None)軸の自動スケーリング有無 (True:オン / False:オフ / None:変更なし)
以下、キーワード引数 3.6 非推奨
xmin (float)3.03.1 非推奨 取り消しx軸表示範囲の最小座標 (leftと同等、同時指定は不可)
xmax (float)3.03.1 非推奨 取り消しx軸表示範囲の最大座標 (rightと同等、同時指定は不可)

※left (x軸表示範囲の左座標)>right (x軸表示範囲の右座標)の場合、軸は反転
axes.get_xlim( )

戻り値x軸の表示範囲
    (left (float:x軸表示範囲の左座標), right (float:x軸表示範囲の右座標))の tuple【タプル】)
axes.set_ylim(
    bottom (y軸表示範囲の下座標)=None,
    top (y軸表示範囲の上座標)=None,
    *, 3.6 推奨
    emit (変更通知有無)=True,
    auto (軸の自動スケーリング有無)=False,
    *, 3.6 非推奨
    ymin (y軸表示範囲の最小座標)3.03.1 非推奨 取り消し =None,
    ymax (y軸表示範囲の最大座標)3.03.1 非推奨 取り消し =None)

戻り値y軸の表示範囲
    (bottom (float:y軸表示範囲の下座標), top (float:y軸表示範囲の上座標))の tuple【タプル】

bottom (float)y軸表示範囲の下座標 (None:変更なし)
    (bottom, top)の tuple【タプル】も指定可
top (float)y軸表示範囲の上座標 (None:変更なし)
以下、キーワード引数 3.6 推奨
emit (bool)変更通知有無
auto (bool | None)軸の自動スケーリング有無 (True:オン / False:オフ / None:変更なし)
以下、キーワード引数 3.6 非推奨
ymin (float)3.03.1 非推奨 取り消しy軸表示範囲の最小座標 (bottomと同等、同時指定は不可)
ymax (float)3.03.1 非推奨 取り消しy軸表示範囲の最大座標 (topと同等、同時指定は不可)

※bottom (y軸表示範囲の下座標)>top (y軸表示範囲の上座標)の場合、軸は反転
axes.get_ylim( )

戻り値y軸の表示範囲
    (bottom (float:y軸表示範囲の下座標), top (float:y軸表示範囲の上座標))の tuple【タプル】)
例
import matplotlib.pyplot as plt
def on_limits_changed(ax):
print('通知', ax.get_xlim(), ax.get_ylim())
# 初期設定
plt.rcParams['font.family'] = 'sans-serif'
plt.rcParams['font.sans-serif'] = \
['Yu Gothic', 'Hiragino Maru Gothic Pro', 'Noto Sans CJK JP']
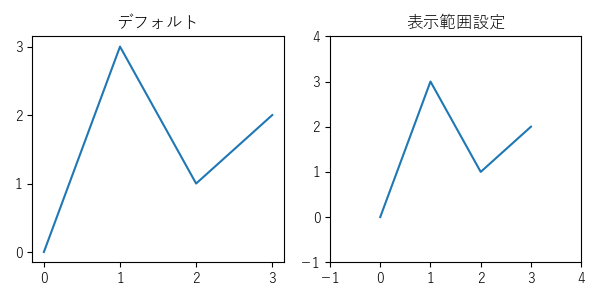
fig, axs = plt.subplots(
1, 2,
figsize=(6, 3),
tight_layout=True,
)
x = [0, 1, 2, 3]
y = [0, 3, 1, 2]
# グラフ (0)
axs[0].set_title('表示範囲設定 (通知有無)')
axs[0].callbacks.connect('xlim_changed', on_limits_changed)
axs[0].callbacks.connect('ylim_changed', on_limits_changed)
axs[0].plot(x, y)
axs[0].set_xticks([t for t in range(-1, 5)])
# 出力:
# 通知 (-0.15000000000000002, 3.15) (0.0, 1.0)
# 通知 (-0.15000000000000002, 3.15) (-0.15000000000000002, 3.15)
axs[0].set_yticks([t for t in range(-2, 6)])
# 表示範囲
xlim = axs[0].set_xlim(
-1,
4,
emit=False,
)
# 出力なし (通知なし)
print(xlim)
# 出力:(-1.0, 4.0)
ylim = axs[0].set_ylim(
ymin=-2,
ymax=5,
emit=True,
)
# 出力:通知 (-1.0, 4.0) (-2.0, 5.0)
print(ylim)
# 出力:(-2.0, 5.0)
print(axs[0].get_xlim())
# 出力:(-1.0, 4.0)
print(axs[0].get_ylim())
# 出力:(-2.0, 5.0)
# グラフ (1)
axs[1].set_title('表示範囲設定 (タプル指定・軸反転)')
axs[1].plot(x, y)
# 表示範囲
xlim = axs[1].set_xlim(
(4, -1),
)
print(xlim)
# 出力:(4.0, -1.0)
ylim = axs[1].set_ylim(
(5, -2),
)
print(ylim)
# 出力:(5.0, -2.0)
print(axs[1].get_xlim())
# 出力:(4.0, -1.0)
print(axs[1].get_ylim())
# 出力:(5.0, -2.0)
# 表示
plt.show()
pyplot.xlim【x軸表示範囲 取得・設定】
pyplot.ylim【y軸表示範囲 取得・設定】
メモ
- pyplotで表示範囲の取得・設定
関連
外部リンク
構文
pyplot.xlim(
    *args,
    **kwargs)

戻り値x軸表示範囲の座標
    (left (x軸表示範囲の左座標), right (x軸表示範囲の右座標))の tuple【タプル】

args可変長位置引数
    (left (x軸表示範囲の左座標), right (x軸表示範囲の右座標))の tuple【タプル】
    または
    left (x軸表示範囲の左座標)
    right (x軸表示範囲の右座標)
kwargs可変長キーワード引数
    left (float)x軸表示範囲の左座標
    right (float)x軸表示範囲の右座標
    その他 (set_xlim【x軸表示範囲 設定】で有効なキーワード引数、下記参照)
    emit (bool)変更通知有無
    auto (bool)軸の自動スケーリング有無 (True:オン / False:オフ / None:変更なし)
    xmin (float)x軸表示範囲の最小座標
    xmax (float)x軸表示範囲の最大座標

※引数未指定は、get_xlim【x軸表示範囲 取得】と同等
※left (x軸表示範囲の左座標) 等>right (x軸表示範囲の右座標) 等の場合、軸は反転
pyplot.ylim(
    *args,
    **kwargs)

戻り値y軸表示範囲の座標
    (bottom (y軸表示範囲の下座標), top (y軸表示範囲の上座標))の tuple【タプル】

args可変長位置引数
    (bottom (y軸表示範囲の下座標), top (y軸表示範囲の上座標))の tuple【タプル】
    または
    bottom (y軸表示範囲の下座標)
    top (y軸表示範囲の上座標)
kwargs可変長キーワード引数
    bottom (float)y軸表示範囲の下座標
    top (float)y軸表示範囲の上座標
    その他 (set_ylim【y軸表示範囲 設定】で有効なキーワード引数、下記参照)
    emit (bool)変更通知有無
    auto (bool)軸の自動スケーリング有無 (True:オン / False:オフ / None:変更なし)
    ymin (float)y軸表示範囲の最小座標
    ymax (float)y軸表示範囲の最大座標

※引数未指定は、get_ylim【y軸表示範囲 取得】と同等
※bottom (y軸表示範囲の下座標) 等>top (y軸表示範囲の上座標) 等の場合、軸は反転
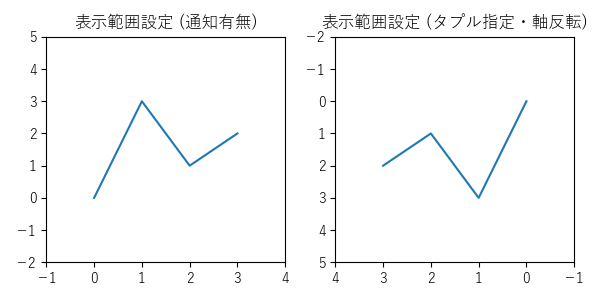
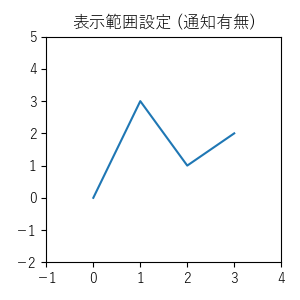
例:(1/2) pyplot.xlim【x軸表示範囲 取得・設定】・pyplot.ylim【y軸表示範囲 取得・設定】
import matplotlib.pyplot as plt

def on_limits_changed(ax):
    print('通知', plt.xlim(), plt.ylim())


# 初期設定
plt.rcParams['font.family'] = 'sans-serif'
plt.rcParams['font.sans-serif'] = \
    ['Yu Gothic', 'Hiragino Maru Gothic Pro', 'Noto Sans CJK JP']
fig = plt.figure(
    figsize=(3, 3),
    tight_layout=True,
)
x = [0, 1, 2, 3]
y = [0, 3, 1, 2]

# グラフ
plt.title('表示範囲設定 (通知有無)')
ax = fig.gca()
ax.callbacks.connect('xlim_changed', on_limits_changed)
ax.callbacks.connect('ylim_changed', on_limits_changed)
plt.plot(x, y)
plt.xticks([t for t in range(-1, 5)])
# 出力:
# 通知 (-0.15000000000000002, 3.15) (0.0, 1.0)
# 通知 (-0.15000000000000002, 3.15) (-0.15000000000000002, 3.15)
plt.yticks([t for t in range(-2, 6)])

# 表示範囲
xlim = plt.xlim(
    -1,
    4,
    emit=False,
)
print(xlim)
# 出力:(-1.0, 4.0)
print(plt.xlim())
# 出力:(-1.0, 4.0)
ylim = plt.ylim(
    -2,
    5,
    emit=True,
)
# 出力:通知 (-1.0, 4.0) (-2.0, 5.0)
print(ylim)
# 出力:(-2.0, 5.0)
print(plt.ylim())
# 出力:(-2.0, 5.0)

# 表示
plt.show()
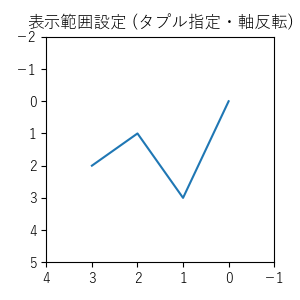
例:(2/2) pyplot.xlim【x軸表示範囲 取得・設定】・pyplot.ylim【y軸表示範囲 取得・設定】
import matplotlib.pyplot as plt

# 初期設定
plt.rcParams['font.family'] = 'sans-serif'
plt.rcParams['font.sans-serif'] = \
    ['Yu Gothic', 'Hiragino Maru Gothic Pro', 'Noto Sans CJK JP']
plt.figure(
    figsize=(3, 3),
    tight_layout=True,
)
x = [0, 1, 2, 3]
y = [0, 3, 1, 2]

# グラフ
plt.title('表示範囲設定 (タプル指定・軸反転)')
plt.plot(x, y)
# 表示範囲
xlim = plt.xlim(
    (4, -1),
)
print(xlim)
# 出力:(4.0, -1.0)
print(plt.xlim())
# 出力:(4.0, -1.0)
ylim = plt.ylim(
    (5, -2),
)
print(ylim)
# 出力:(5.0, -2.0)
print(plt.ylim())
# 出力:(5.0, -2.0)

# 表示
plt.show()
axes.Axes.axis【表示範囲等 取得・設定】3.1 ~ 3.4 / 3.7
pyplot.axis【表示範囲等 取得・設定】3.1 ~ 3.4 / 3.7
メモ
- 表示範囲等の取得・設定
関連
外部リンク
構文
axes.axis(
    *args, 3.7
    arg=None, 3.7
    /, 3.7
    *, 3.7
    emit=True, 3.2
    **kwargs)
pyplot.axis(同上)
戻り値表示範囲の座標
    (xmin, xmax, ymin, ymax)の tuple【タプル】

args可変長位置引数 3.7 (位置引数は1つのみ3.4 )
arg位置引数 (以下の1つ) 3.7
    表示範囲 (list)[xmin, xmax, ymin, ymax] のリスト
    True軸と軸ラベル表示 ('on' と同等) 3.1
    False軸と軸ラベル非表示 ('off' と同等) 3.1
    'on'軸と軸ラベル表示
    'off'軸と軸ラベル非表示
    'equal'表示範囲を変更し、両軸を同じスケーリング (円は正円:ax.set_aspect('equal', adjustable='datalim')と同等)
    'scaled'表示領域のサイズを変更し、両軸を同じスケーリング (円は正円:ax.set_aspect('equal', adjustable='box', anchor='C')と同等)
    'tight'全データ表示可能な表示範囲に変更し、以降の自動スケーリング無効
    'auto'自動スケーリング (全データ表示)
    'normal''auto'(自動スケーリング)と同等 3.03.3
    'image'表示範囲をデータ範囲と一致させ、'scaled'処理
    'square'正方形プロット (xmax-xmin == ymax-ymin とし、'scaled'処理)
ここより前は、位置引数のみ 3.7
ここより後ろは、キーワード引数のみ 3.7
emit変更通知有無 3.2
kwargsキーワード引数 (arg (位置引数)と同時指定は不可)
    emit変更通知有無3.2
    xminx軸表示範囲の最小座標
    xmaxx軸表示範囲の最大座標
    yminy軸表示範囲の最小座標
    ymaxy軸表示範囲の最大座標
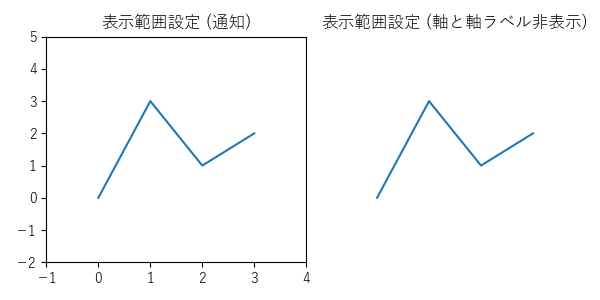
例:(1/2) axes.Axes.axis【表示範囲等 取得・設定】
import matplotlib.pyplot as plt

def on_limits_changed(ax):
    print('通知', ax.get_xlim(), ax.get_ylim())


# 初期設定
plt.rcParams['font.family'] = 'sans-serif'
plt.rcParams['font.sans-serif'] = \
    ['Yu Gothic', 'Hiragino Maru Gothic Pro', 'Noto Sans CJK JP']
fig, axs = plt.subplots(
    1, 2,
    figsize=(6, 3),
    tight_layout=True,
)
x = [0, 1, 2, 3]
y = [0, 3, 1, 2]

# グラフ (0)
axs[0].set_title('表示範囲設定 (通知)')
axs[0].callbacks.connect('xlim_changed', on_limits_changed)
axs[0].callbacks.connect('ylim_changed', on_limits_changed)
axs[0].plot(x, y)
axs[0].set_xticks([t for t in range(-1, 5)])
# 出力:
# 通知 (-0.15000000000000002, 3.15) (0.0, 1.0)
# 通知 (-0.15000000000000002, 3.15) (-0.15000000000000002, 3.15)
axs[0].set_yticks([t for t in range(-2, 6)])
# 表示範囲
lims = axs[0].axis(
    [-1, 4, -2, 5],
    emit=True,  # デフォルト
)
# 出力:
# 通知 (-1.0, 4.0) (-2.0, 5.0)
# 通知 (-1.0, 4.0) (-2.0, 5.0)
print(lims)
# 出力:(-1.0, 4.0, -2.0, 5.0)

# グラフ (1)
axs[1].set_title('表示範囲設定 (軸と軸ラベル非表示)')
axs[1].plot(x, y)
# 軸と軸ラベル非表示
axs[1].axis(False)
# 表示範囲
lims = axs[1].axis(
    [-1, 4, -2, 5],
)
print(lims)
# 出力:(-1.0, 4.0, -2.0, 5.0)

# 表示
plt.show()
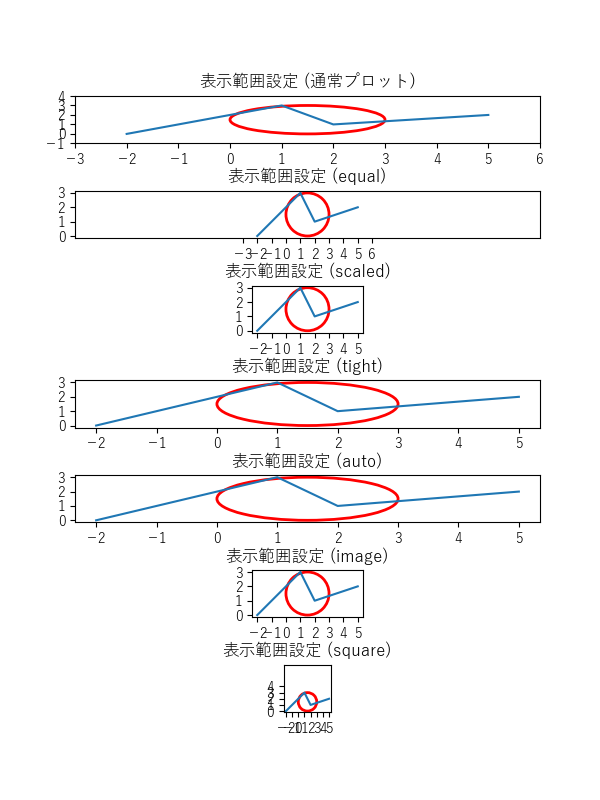
例:(2/2) axes.Axes.axis【表示範囲等 取得・設定】
import matplotlib.pyplot as plt
from matplotlib.patches import Circle

# 初期設定
plt.rcParams['font.family'] = 'sans-serif'
plt.rcParams['font.sans-serif'] = \
    ['Yu Gothic', 'Hiragino Maru Gothic Pro', 'Noto Sans CJK JP']
fig, axs = plt.subplots(
    7, 1,
    figsize=(6, 8),
)
fig.subplots_adjust(hspace=1.0)
x = [-2, 1, 2, 5]
y = [0, 3, 1, 2]
limits = [-3, 6, -1, 4]

# グラフ (0)
axs[0].set_title('表示範囲設定 (通常プロット)')
axs[0].plot(x, y)
axs[0].set_xticks([t for t in range(-3, 7)])
axs[0].set_yticks([t for t in range(-1, 5)])
circle0 = Circle((1.5, 1.5), 1.5, color='red', fill=False, linewidth=2)
axs[0].add_patch(circle0)
# 表示範囲
lims = axs[0].axis(limits)
print(lims)
# 出力:(-3.0, 6.0, -1.0, 4.0)

# グラフ (1)
axs[1].set_title('表示範囲設定 (equal)')
axs[1].plot(x, y)
axs[1].set_xticks([t for t in range(-3, 7)])
axs[1].set_yticks([t for t in range(-1, 5)])
circle1 = Circle((1.5, 1.5), 1.5, color='red', fill=False, linewidth=2)
axs[1].add_patch(circle1)
# 表示範囲
axs[1].axis(limits)
axs[1].axis('equal')
print(axs[1].axis())
# 出力:(-2.35, 5.35, -0.15000000000000002, 3.15)

# グラフ (2)
axs[2].set_title('表示範囲設定 (scaled)')
axs[2].plot(x, y)
axs[2].set_xticks([t for t in range(-3, 7)])
axs[2].set_yticks([t for t in range(-1, 5)])
circle2 = Circle((1.5, 1.5), 1.5, color='red', fill=False, linewidth=2)
axs[2].add_patch(circle2)
# 表示範囲
axs[2].axis(limits)
axs[2].axis('scaled')
print(axs[2].axis())
# 出力:(-2.35, 5.35, -0.15000000000000002, 3.15)

# グラフ (3)
axs[3].set_title('表示範囲設定 (tight)')
axs[3].plot(x, y)
axs[3].set_xticks([t for t in range(-3, 7)])
axs[3].set_yticks([t for t in range(-1, 5)])
circle3 = Circle((1.5, 1.5), 1.5, color='red', fill=False, linewidth=2)
axs[3].add_patch(circle3)
# 表示範囲
axs[3].axis(limits)
axs[3].axis('tight')
print(axs[3].axis())
# 出力:(-2.35, 5.35, -0.15000000000000002, 3.15)

# グラフ (4)
axs[4].set_title('表示範囲設定 (auto)')
axs[4].plot(x, y)
axs[4].set_xticks([t for t in range(-3, 7)])
axs[4].set_yticks([t for t in range(-1, 5)])
circle4 = Circle((1.5, 1.5), 1.5, color='red', fill=False, linewidth=2)
axs[4].add_patch(circle4)
# 表示範囲
axs[4].axis(limits)
axs[4].axis('auto')
print(axs[4].axis())
# 出力:(-2.35, 5.35, -0.15000000000000002, 3.15)

# グラフ (5)
axs[5].set_title('表示範囲設定 (image)')
axs[5].plot(x, y)
axs[5].set_xticks([t for t in range(-3, 7)])
axs[5].set_yticks([t for t in range(-1, 5)])
circle5 = Circle((1.5, 1.5), 1.5, color='red', fill=False, linewidth=2)
axs[5].add_patch(circle5)
# 表示範囲
axs[5].axis(limits)
axs[5].axis('image')
print(axs[5].axis())
# 出力:(-2.35, 5.35, -0.15000000000000002, 3.15)

# グラフ (6)
axs[6].set_title('表示範囲設定 (square)')
axs[6].plot(x, y)
axs[6].set_xticks([t for t in range(-3, 7)])
axs[6].set_yticks([t for t in range(-1, 5)])
circle6 = Circle((1.5, 1.5), 1.5, color='red', fill=False, linewidth=2)
axs[6].add_patch(circle6)
# 表示範囲
axs[6].axis(limits)
axs[6].axis('square')
print(axs[6].axis())
# 出力:(-2.35, 5.35, -0.15000000000000002, 7.549999999999999)

# 表示
plt.show()
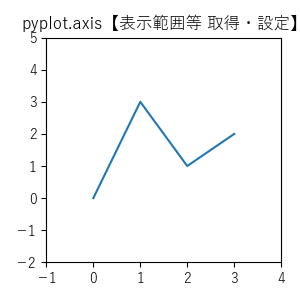
例:pyplot.axis【表示範囲等 取得・設定】
import matplotlib.pyplot as plt

# 初期設定
plt.rcParams['font.family'] = 'sans-serif'
plt.rcParams['font.sans-serif'] = \
    ['Yu Gothic', 'Hiragino Maru Gothic Pro', 'Noto Sans CJK JP']
plt.figure(
    figsize=(3, 3),
    tight_layout=True,
)
x = [0, 1, 2, 3]
y = [0, 3, 1, 2]

# グラフ
plt.title('pyplot.axis【表示範囲等 取得・設定】')
plt.plot(x, y)

# 表示範囲
lims = plt.axis([-1, 4, -2, 5])
# plt.axis(xmin=-1, xmax=4, ymin=-2, ymax=5)
print(lims)
# 出力:(-1.0, 4.0, -2.0, 5.0)
print(plt.axis())
# 出力:(-1.0, 4.0, -2.0, 5.0)

# 表示
plt.show()