グリッド線関連
Axes.grid【グリッド線 設定】3.5
pyplot.grid【グリッド線 設定】3.5
axis.Axis.grid【軸グリッド線 設定】3.5
Axes.get_xgridlines・Axes.get_ygridlines【x・y軸グリッド線 取得】
axis.Axis.get_gridlines【軸グリッド線 取得】
Axes.grid【グリッド線 設定】3.5
pyplot.grid【グリッド線 設定】3.5
axis.Axis.grid【軸グリッド線 設定】3.5
メモ
- グリッド線の設定
関連
外部リンク
構文
axes.grid( b visible3.5 =None, which='major', axis='both', **kwargs)
pyplot.grid(同上)
axis.grid( b visible3.5 =None, which='major', **kwargs)
b (bool | None)引数名変更3.5
visible (bool | None)3.5グリッド線の表示有無
    kwargs (グリッド線のプロパティ)指定は、True
    Noneでkwargs (グリッド線のプロパティ)未指定は表示切り替え
which (str)グリッド線の指定
    'major'主グリッド線
    'minor'補助グリッド線
    'both'両方
axis (str)軸の指定
    'both'両方
    'x'x軸
    'y'y軸
kwargs (可変長キーワード引数)グリッド線のプロパティ (下記参照)
グリッド線のプロパティ (Line2D【線分】)
(Zオーダーは、Axes.set_axisbelow【Zオーダー簡易設定 (目盛り・グリッド線)】または artist.Artist.set_zorder【Zオーダー設定】で設定)
| プロパティ | 型 | デフォルト | get_* | set_* | 備考 | ||||||||||||||||||||||||
|---|---|---|---|---|---|---|---|---|---|---|---|---|---|---|---|---|---|---|---|---|---|---|---|---|---|---|---|---|---|
| agg_filter | callable | Artist | Artist | agg フィルター | |||||||||||||||||||||||||
| alpha | スカラー None | Artist | Artist | アルファ値 (0:透明 ~ 1:不透明) (線とマーカー共有) | |||||||||||||||||||||||||
| animated | bool | Artist | Artist | アニメーション使用の有無 | |||||||||||||||||||||||||
| antialiased aa 3.1 | bool | ● ● | ● ● | アンチエイリアス処理の有無 | |||||||||||||||||||||||||
| clip_box | Bbox | Artist | Artist | ||||||||||||||||||||||||||
| clip_on | bool | Artist | Artist | クリッピングの有無 (True:範囲内のみ描画 / False:範囲外にも描画可) | |||||||||||||||||||||||||
| clip_path | Patch (Path, Transform) None | Artist | Artist | ||||||||||||||||||||||||||
| color c 3.1 | color【色定義】 | ● ● | ● ● | 線の色 | |||||||||||||||||||||||||
| contains 3.3 | callable | get_pickradius | set_pickradius | ピッカーイベント (参照:picker【ピッカーイベント】) | |||||||||||||||||||||||||
| dash_capstyle | CapStyle3.4 str | 'projecting' | ● | ● | 実線以外の線端スタイル (実線は solid_capstyle 参照)
| ||||||||||||||||||||||||
| dash_joinstyle | JoinStyle3.4 str | 'round' | ● | ● | 実線以外の結合スタイル (実線は solid_joinstyle 参照)
| ||||||||||||||||||||||||
| dashes | sequence of floats (on/off ink in points) (None, None) | get_linestyle | ● | ||||||||||||||||||||||||||
| data | (2, N) array two 1D arrays | ● | ● | ||||||||||||||||||||||||||
| drawstyle ds 3.1 | str | 'default' | ● ● | ● ● | 線の接続スタイル
| ||||||||||||||||||||||||
| figure | Figure | Artist | Artist | 所属フィギュア | |||||||||||||||||||||||||
| fillstyle | str | ● | ● | マーカー塗りつぶしスタイル (参照:markerfacecolor・markerfacecoloralt)
| |||||||||||||||||||||||||
| gapcolor 3.6 | color【色定義】 None | ● | ● | 破線スタイルのギャップ色 | |||||||||||||||||||||||||
| gid | str | Artist | Artist | グループId (識別子として利用可) | |||||||||||||||||||||||||
| in_layout | bool | Artist | Artist | レイアウト計算に含めるか否か | |||||||||||||||||||||||||
| label | object | Artist | Artist | 凡例ラベル (アンダースコアで始まるラベルは対象外) | |||||||||||||||||||||||||
| linestyle ls 3.1 | str (offset, on-off-seq) | ● ● | ● ● | 線種
| |||||||||||||||||||||||||
| linewidth lw 3.1 | float | ● ● | ● ● | 線の幅 | |||||||||||||||||||||||||
| marker | str Path MarkerStyle | ● | ● | マーカースタイル (詳細は、マーカー定義 参照) | |||||||||||||||||||||||||
| markeredgecolor mec 3.1 | color【色定義】 | ● ● | ● ● | マーカー外枠の色 | |||||||||||||||||||||||||
| markeredgewidth mew 3.1 | float | ● ● | ● ● | マーカー外枠の幅 | |||||||||||||||||||||||||
| markerfacecolor mfc 3.1 | color【色定義】 | ● ● | ● ● | マーカーの塗りつぶし色 (参考:fillstyle) | |||||||||||||||||||||||||
| markerfacecoloralt mfcalt 3.1 | color【色定義】 | ● ● | ● ● | fillstyle【マーカー塗りつぶしスタイル】指定の残り部分の塗りつぶし色 | |||||||||||||||||||||||||
| markersize ms 3.1 | float | ● ● | ● ● | マーカーのサイズ (ポイント単位) | |||||||||||||||||||||||||
| markevery | 各種 (マーカー頻度 参照) | ● | ● | マーカー頻度 (詳細 参照) | |||||||||||||||||||||||||
| path_effects | AbstractPathEffect | Artist | Artist | ||||||||||||||||||||||||||
| picker | callable[[Artist, Event], tuple[bool, dict]] float 3.3 | Artist | ● | callable:ピッカーイベント float:ピッカー有効半径 (参照:contains【ピッカーイベント】3.3 ) | |||||||||||||||||||||||||
| pickradius | float | ● | ● | ピッカー有効半径 | |||||||||||||||||||||||||
| rasterized | bool | Artist | Artist | ラスタライズ(ビットマップ) 描画の強制有無 | |||||||||||||||||||||||||
| sketch_params | (scale: float, length: float, randomness: float) | Artist | Artist | ||||||||||||||||||||||||||
| snap | bool None | Artist | Artist | スナップ (ピクセル位置補正) の有無 (Agg・MacOSX バックエンドのみサポート) | |||||||||||||||||||||||||
| solid_capstyle | CapStyle3.4 str | 'projecting' | ● | ● | 実線の線端スタイル (実線以外は dash_capstyle 参照)
| ||||||||||||||||||||||||
| solid_joinstyle | JoinStyle3.4 str | 'round' | ● | ● | 実線の結合スタイル (実線以外は dash_joinstyle 参照)
| ||||||||||||||||||||||||
| transform | matplotlib.transforms.Transform | Artist | ● | 座標変換 | |||||||||||||||||||||||||
| url | str | Artist | Artist | ハイパーリンクURL (SVG のみ対応) | |||||||||||||||||||||||||
| visible | bool | Artist | Artist | 表示有無 | |||||||||||||||||||||||||
| xdata | 1D array | ● | ● | x軸データ | |||||||||||||||||||||||||
| ydata | 1D array | ● | ● | y軸データ | |||||||||||||||||||||||||
| zorder | float | Artist | Artist | Zオーダー (大きい方が手前) | |||||||||||||||||||||||||
例:Axes.grid【グリッド線 設定】
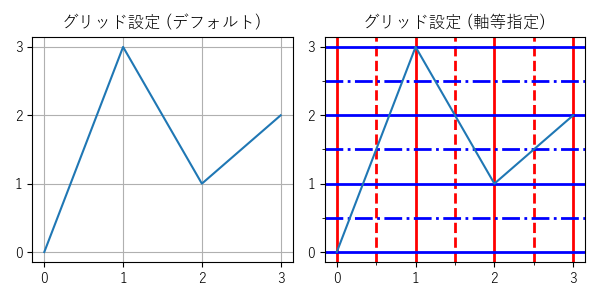
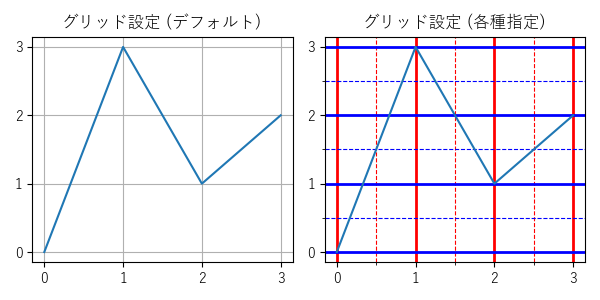
import matplotlib.pyplot as plt

# 初期設定
plt.rcParams['font.family'] = 'sans-serif'
plt.rcParams['font.sans-serif'] = \
    ['Yu Gothic', 'Hiragino Maru Gothic Pro', 'Noto Sans CJK JP']
fig, axs = plt.subplots(
    1, 2,
    figsize=(6, 3),
    tight_layout=True,
)
x0 = [0, 1, 2, 3]
y0 = [0, 3, 1, 2]
x1 = [0.5, 1.5, 2.5]
y1 = [0.5, 1.5, 2.5]

# グラフ (0)
axs[0].set_title('グリッド設定 (デフォルト)')
axs[0].plot(x0, y0)
axs[0].set_xticks(x0)
axs[0].set_yticks(y0)
# グリッド
axs[0].grid()

# グラフ (1)
axs[1].set_title('グリッド設定 (軸等指定)')
axs[1].plot(x0, y0)
axs[1].set_xticks(x0)
axs[1].set_xticks(x1, minor=True)
axs[1].set_yticks(y0)
axs[1].set_yticks(y1, minor=True)
# グリッド
axs[1].grid(
    axis='x',
    color='red',
    linewidth=2,
)
axs[1].grid(
    which='minor',
    axis='x',
    color='red',
    linestyle='--',
    linewidth=2,
)
axs[1].grid(
    axis='y',
    color='blue',
    linewidth=2,
)
axs[1].grid(
    which='minor',
    axis='y',
    color='blue',
    linestyle='-.',
    linewidth=2,
)

# 表示
plt.show()
例:pyplot.grid【グリッド線 設定】
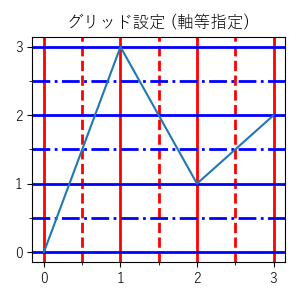
import matplotlib.pyplot as plt

# 初期設定
plt.rcParams['font.family'] = 'sans-serif'
plt.rcParams['font.sans-serif'] = \
    ['Yu Gothic', 'Hiragino Maru Gothic Pro', 'Noto Sans CJK JP']
plt.figure(figsize=(3, 3), tight_layout=True)
x0 = [0, 1, 2, 3]
y0 = [0, 3, 1, 2]
x1 = [0.5, 1.5, 2.5]
y1 = [0.5, 1.5, 2.5]

# グラフ
plt.title('グリッド設定 (軸等指定)')
plt.plot(x0, y0)
plt.xticks(x0)
plt.xticks(x1, minor=True)
plt.yticks(y0)
plt.yticks(y1, minor=True)
# グリッド
plt.grid(
    axis='x',
    color='red',
    linewidth=2,
)
plt.grid(
    which='minor',
    axis='x',
    color='red',
    linestyle='--',
    linewidth=2,
)
plt.grid(
    axis='y',
    color='blue',
    linewidth=2,
)
plt.grid(
    which='minor',
    axis='y',
    color='blue',
    linestyle='-.',
    linewidth=2,
)

# 表示
plt.show()
例:axis.Axis.grid【軸グリッド線 設定】
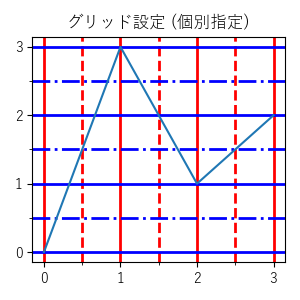
import matplotlib.pyplot as plt

# 初期設定
plt.rcParams['font.family'] = 'sans-serif'
plt.rcParams['font.sans-serif'] = \
    ['Yu Gothic', 'Hiragino Maru Gothic Pro', 'Noto Sans CJK JP']
fig, ax = plt.subplots(
    1, 1,
    figsize=(3, 3),
    tight_layout=True,
)
x0 = [0, 1, 2, 3]
y0 = [0, 3, 1, 2]
x1 = [0.5, 1.5, 2.5]
y1 = [0.5, 1.5, 2.5]

# グラフ
ax.set_title('グリッド設定 (個別指定)')
ax.plot(x0, y0)
ax.set_xticks(x0)
ax.set_xticks(x1, minor=True)
ax.set_yticks(y0)
ax.set_yticks(y1, minor=True)
# グリッド
ax.xaxis.grid(
    color='red',
    linewidth=2,
)
ax.xaxis.grid(
    which='minor',
    color='red',
    linestyle='--',
    linewidth=2,
)
ax.yaxis.grid(
    color='blue',
    linewidth=2,
)
ax.yaxis.grid(
    which='minor',
    color='blue',
    linestyle='-.',
    linewidth=2,
)

# 表示
plt.show()
Axes.get_xgridlines【x軸グリッド線 取得】
Axes.get_ygridlines【y軸グリッド線 取得】
axis.Axis.get_gridlines【軸グリッド線 取得】
メモ
- グリッド線の取得
- 線分のリストで取得
- 主グリッド線のみ取得
- 取得したグリッド線は変更可
関連
外部リンク
構文
例
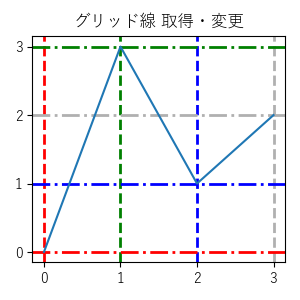
import matplotlib.pyplot as plt

# 初期設定
plt.rcParams['font.family'] = 'sans-serif'
plt.rcParams['font.sans-serif'] = \
    ['Yu Gothic', 'Hiragino Maru Gothic Pro', 'Noto Sans CJK JP']
fig, ax = plt.subplots(
    1, 1,
    figsize=(3, 3),
    tight_layout=True,
)
x = [0, 1, 2, 3]
y = [0, 3, 1, 2]

# グラフ
ax.set_title('グリッド線 取得・変更')
ax.plot(x, y)
ax.set_xticks(x)
ax.set_yticks(y)
# グリッド
ax.grid()

# x軸グリッド線 取得・変更
x_lines_axes = ax.get_xgridlines()
print(len(x_lines_axes))
# 出力:4
x_lines_axes[0].set_color('red')
x_lines_axes[1].set_color('green')
x_lines_axes[2].set_color('blue')

# y軸グリッド線 取得・変更
y_lines_axes = ax.get_ygridlines()
print(len(y_lines_axes))
# 出力:4
y_lines_axes[0].set_color('red')
y_lines_axes[1].set_color('green')
y_lines_axes[2].set_color('blue')

# x軸グリッド線 取得・変更
x_lines_axis = ax.xaxis.get_gridlines()
print(len(x_lines_axis))
# 出力:4
for line in x_lines_axis:
    line.set_linewidth(2)
    line.set_linestyle('--')

# y軸グリッド線 取得・変更
y_lines_axis = ax.yaxis.get_gridlines()
print(len(y_lines_axis))
# 出力:4
for line in y_lines_axis:
    line.set_linewidth(2)
    line.set_linestyle('-.')

# 表示
plt.show()


