目盛りフォーマット設定・取得
ticklabel_format【目盛りフォーマット設定 (指数形式)】
pyplot.ticklabel_format【目盛りフォーマット設定 (指数形式)】
axis.Axis.set_major_formatter【目盛りフォーマッタ設定 (主)】3.3
axis.Axis.set_minor_formatter【目盛りフォーマッタ設定 (補助)】3.3
axis.Axis.get_major_formatter【目盛りフォーマッタ取得 (主)】
axis.Axis.get_minor_formatter【目盛りフォーマッタ取得 (補助)】
関連: 目盛り設定・取得 目盛りラベル設定・取得 各種目盛りフォーマッタ
ticklabel_format【目盛りフォーマット設定 (指数形式)】
pyplot.ticklabel_format【目盛りフォーマット設定 (指数形式)】
メモ
- 目盛りフォーマットの設定 (指数形式)
関連
外部リンク
構文
axes.ticklabel_format(
    *,
    axis='both',
    style='',
    scilimits=None,
    useOffset=None,
    useLocale=None,
    useMathText=None)
pyplot.ticklabel_format(同上)
axis対象軸
    'x':x軸
    'y':y軸
    'both':x軸・y軸 両方
styleスタイル
    'sci'・'scientific'・'' (省略):指数表記 (科学的表記)
    'plain':指数表記なし
scilimits指数表示なしの範囲指定 (int のペア:配列・タプル等)
    デフォルト:[-7, 7][-5, 6]3.2 (rcParams["axes.formatter.limits"])
    (0, 0):全ての範囲で指数部表示
    (m, m):10m で固定
    (m, n):10m ~ 10n 以外は指数部表示
useOffset (bool | float)オフセットの使用有無・オフセット値
    True:オフセットあり [自動計算] (デフォルト:rcParams["axes.formatter.useoffset"])
    False:オフセットなし
    float:オフセット値指定
useLocale (bool)ロケール使用の有無 (小数点・正符号で使用)
    True:現在ロケール
    False:C ロケール [英語] (デフォルト:rcParams["axes.formatter.use_locale"])
useMathText (bool)数学フォーマットの使用有無
    True:10N 形式
    False:1eN 形式 (デフォルト:rcParams["axes.formatter.use_mathtext"])

AttributeError 例外デフォルトの ScalarFormatter【スカラー フォーマッタ】 以外の使用
例
import matplotlib.pyplot as plt
# 初期設定
plt.rcParams['font.family'] = 'sans-serif'
plt.rcParams['font.sans-serif'] =\
['Yu Gothic', 'Hiragino Maru Gothic Pro', 'Noto Sans CJK JP']
fig, axs = plt.subplots(
1, 2,
figsize=(6, 3),
tight_layout=True,
)
x = [0, 0.0001, 0.0002, 0.0003]
y = [0, 30000, 10000, 20000]
# グラフ0
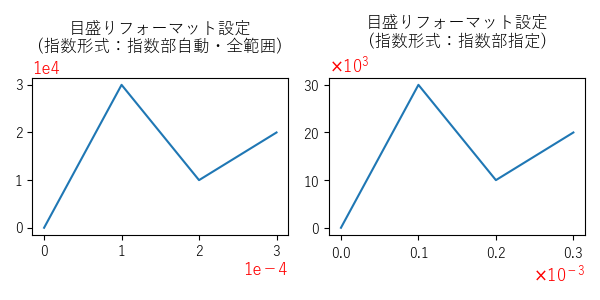
axs[0].set_title('目盛りフォーマット設定\n(指数形式:指数部自動・全範囲)')
axs[0].plot(x, y)
axs[0].ticklabel_format(
scilimits=(0, 0), # 全範囲
)
axs[0].xaxis.offsetText.set_fontsize(12)
axs[0].xaxis.offsetText.set_color('red')
axs[0].yaxis.offsetText.set_fontsize(12)
axs[0].yaxis.offsetText.set_color('red')
# グラフ1
axs[1].set_title('目盛りフォーマット設定\n(指数形式:指数部指定)')
axs[1].plot(x, y)
axs[1].ticklabel_format(
axis='x',
style='sci',
scilimits=(-3, -3), # x10^(-3) 指定
useMathText=True, # x10^N
)
axs[1].ticklabel_format(
axis='y',
style='sci',
scilimits=(3, 3), # x10^3 指定
useMathText=True, # x10^N
)
axs[1].xaxis.offsetText.set_fontsize(12)
axs[1].xaxis.offsetText.set_color('red')
axs[1].yaxis.offsetText.set_fontsize(12)
axs[1].yaxis.offsetText.set_color('red')
# 表示
plt.show()
import matplotlib.pyplot as plt
# 初期設定
plt.rcParams['font.family'] = 'sans-serif'
plt.rcParams['font.sans-serif'] = \
['Yu Gothic', 'Hiragino Maru Gothic Pro', 'Noto Sans CJK JP']
fig, axs = plt.subplots(
2, 2,
figsize=(6, 6),
tight_layout=True,
)
x = [1, 1.0001, 1.0002, 1.0003]
y = [0, 3000, 1000, 2000]
# グラフ0-0
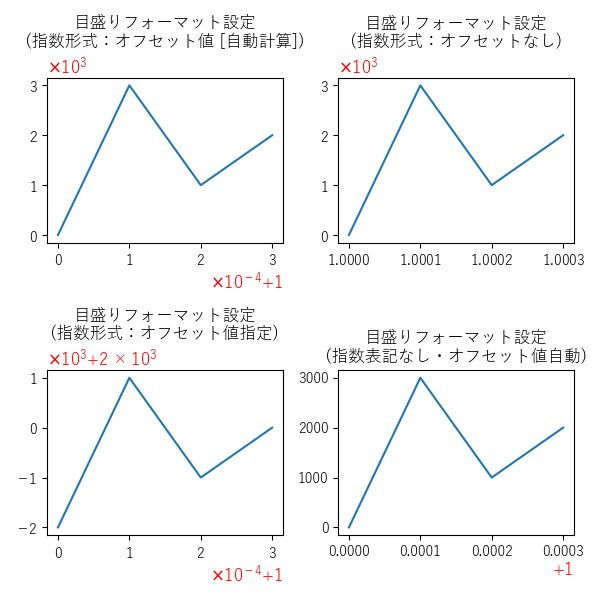
axs[0, 0].set_title('目盛りフォーマット設定\n(指数形式:オフセット値 [自動計算])')
axs[0, 0].plot(x, y)
axs[0, 0].ticklabel_format(
axis='x',
scilimits=(0, 0), # 全範囲
useMathText=True, # x10^N
useOffset=True,
)
axs[0, 0].ticklabel_format(
axis='y',
scilimits=(0, 0), # 全範囲
useMathText=True, # x10^N
useOffset=True,
)
axs[0, 0].xaxis.offsetText.set_fontsize(12)
axs[0, 0].xaxis.offsetText.set_color('red')
axs[0, 0].yaxis.offsetText.set_fontsize(12)
axs[0, 0].yaxis.offsetText.set_color('red')
# グラフ0-1
axs[0, 1].set_title('目盛りフォーマット設定\n(指数形式:オフセットなし)')
axs[0, 1].plot(x, y)
axs[0, 1].ticklabel_format(
axis='x',
scilimits=(0, 0), # 全範囲
useMathText=True, # x10^N
useOffset=False, # オフセットなし
)
axs[0, 1].ticklabel_format(
axis='y',
scilimits=(0, 0), # 全範囲
useMathText=True, # x10^N
useOffset=False, # オフセットなし
)
axs[0, 1].xaxis.offsetText.set_fontsize(12)
axs[0, 1].xaxis.offsetText.set_color('red')
axs[0, 1].yaxis.offsetText.set_fontsize(12)
axs[0, 1].yaxis.offsetText.set_color('red')
# グラフ1-0
axs[1, 0].set_title('目盛りフォーマット設定\n(指数形式:オフセット値指定)')
axs[1, 0].plot(x, y)
axs[1, 0].ticklabel_format(
axis='x',
scilimits=(0, 0), # 全範囲
useMathText=True, # x10^N
useOffset=1.0, # オフセット値
)
axs[1, 0].ticklabel_format(
axis='y',
scilimits=(0, 0), # 全範囲
useMathText=True, # x10^N
useOffset=2000, # オフセット値
)
axs[1, 0].xaxis.offsetText.set_fontsize(12)
axs[1, 0].xaxis.offsetText.set_color('red')
axs[1, 0].yaxis.offsetText.set_fontsize(12)
axs[1, 0].yaxis.offsetText.set_color('red')
# グラフ1-1
axs[1, 1].set_title('目盛りフォーマット設定\n(指数表記なし・オフセット値自動)')
axs[1, 1].plot(x, y)
axs[1, 1].ticklabel_format(
style='plain',
)
axs[1, 1].xaxis.offsetText.set_fontsize(12)
axs[1, 1].xaxis.offsetText.set_color('red')
axs[1, 1].yaxis.offsetText.set_fontsize(12)
axs[1, 1].yaxis.offsetText.set_color('red')
# 表示
plt.show()
import matplotlib.pyplot as plt
# 初期設定
plt.rcParams['font.family'] = 'sans-serif'
plt.rcParams['font.sans-serif'] =\
['Yu Gothic', 'Hiragino Maru Gothic Pro', 'Noto Sans CJK JP']
plt.figure(figsize=(4, 3), tight_layout=True)
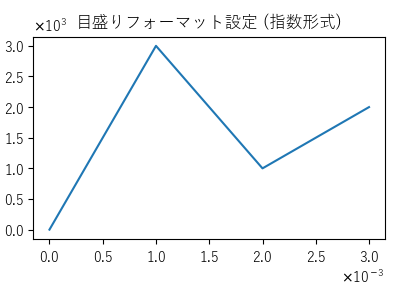
plt.title('目盛りフォーマット設定 (指数形式)')
# グラフ
x = [0, 0.001, 0.002, 0.003]
y = [0, 3000, 1000, 2000]
plt.plot(x, y)
# 目盛りフォーマット設定 (指数形式)
plt.ticklabel_format(
axis='x',
scilimits=(-3, -3), # x10^(-3) 指定
useMathText=True, # x10^N
)
plt.ticklabel_format(
axis='y',
scilimits=(3, 3), # x10^3 指定
useMathText=True, # x10^N
)
# 表示
plt.show()
axis.Axis.set_major_formatter【目盛りフォーマッタ設定 (主)】3.3
axis.Axis.set_minor_formatter【目盛りフォーマッタ設定 (補助)】3.3
axis.Axis.get_major_formatter【目盛りフォーマッタ取得 (主)】
axis.Axis.get_minor_formatter【目盛りフォーマッタ取得 (補助)】
メモ
- 目盛りフォーマッタの設定・取得
関連
外部リンク
構文
axis.set_major_formatter(formatter)
axis.set_minor_formatter(同上)
formatter (Formatter | str | function)フォーマッタ
    Formatter各種フォーマッタ
    str3.3StrMethodFormatter【フォーマット文字列フォーマッタ (新)】 使用
    function3.3FuncFormatter【ユーザー定義関数フォーマッタ】 使用
axis.get_major_formatter( )
axis.get_minor_formatter( )
戻り値フォーマッタ
例
import matplotlib.pyplot as plt
import matplotlib.ticker as ptick
# 初期設定
plt.rcParams['font.family'] = 'sans-serif'
plt.rcParams['font.sans-serif'] =\
['Yu Gothic', 'Hiragino Maru Gothic Pro', 'Noto Sans CJK JP']
fig, axs = plt.subplots(
2, 2,
figsize=(7, 6),
tight_layout=True,
)
x = [0, 1, 2, 3]
y = [0, 3_000_000, 1_000_000, 2_000_000]
# グラフ0-0
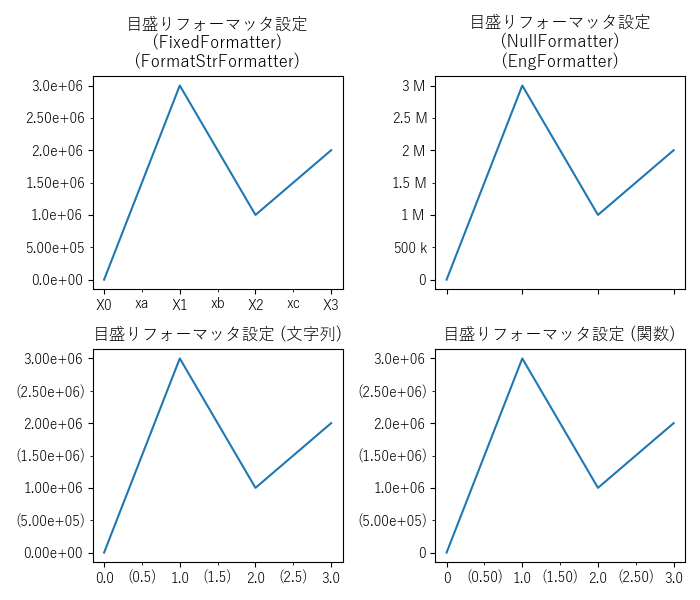
axs[0, 0].set_title('目盛りフォーマッタ設定\n(FixedFormatter)\n(FormatStrFormatter)')
axs[0, 0].plot(x, y)
axs[0, 0].set_xticks(x)
axs[0, 0].set_xticks([0.5, 1.5, 2.5], minor=True)
print(axs[0, 0].xaxis.get_major_formatter())
# 出力:<matplotlib.ticker.ScalarFormatter object at 0x~>
axs[0, 0].xaxis.set_major_locator(ptick.FixedLocator([0, 1, 2, 3]))
axs[0, 0].xaxis.set_minor_locator(ptick.FixedLocator([0.5, 1.5, 2.5]))
axs[0, 0].xaxis.set_major_formatter(ptick.FixedFormatter(['X0', 'X1', 'X2', 'X3']))
axs[0, 0].xaxis.set_minor_formatter(ptick.FixedFormatter(['xa', 'xb', 'xc']))
print(axs[0, 0].xaxis.get_major_formatter())
# 出力:<matplotlib.ticker.FixedFormatter object at 0x~>
print(axs[0, 0].xaxis.get_minor_formatter())
# 出力:<matplotlib.ticker.FixedFormatter object at 0x~>
axs[0, 0].set_yticks(y)
axs[0, 0].set_yticks([500_000, 1_500_000, 2_500_000], minor=True)
axs[0, 0].yaxis.set_major_formatter(ptick.FormatStrFormatter('%.1e'))
axs[0, 0].yaxis.set_minor_formatter(ptick.FormatStrFormatter('%.2e'))
print(axs[0, 0].yaxis.get_major_formatter())
# 出力:<matplotlib.ticker.FormatStrFormatter object at 0x~>
print(axs[0, 0].yaxis.get_minor_formatter())
# 出力:<matplotlib.ticker.FormatStrFormatter object at 0x~>
# グラフ0-1
axs[0, 1].set_title('目盛りフォーマッタ設定\n(NullFormatter)\n(EngFormatter)')
axs[0, 1].plot(x, y)
axs[0, 1].xaxis.set_major_formatter(ptick.NullFormatter())
print(axs[0, 1].xaxis.get_major_formatter())
# 出力:<matplotlib.ticker.NullFormatter object at 0x~>
print(axs[0, 1].xaxis.get_minor_formatter())
# 出力:<matplotlib.ticker.NullFormatter object at 0x~>
axs[0, 1].set_yticks(y)
axs[0, 1].set_yticks([500_000, 1_500_000, 2_500_000], minor=True)
axs[0, 1].yaxis.set_major_formatter(ptick.EngFormatter())
axs[0, 1].yaxis.set_minor_formatter(ptick.EngFormatter())
print(axs[0, 1].yaxis.get_major_formatter())
# 出力:<matplotlib.ticker.EngFormatter object at 0x~>
print(axs[0, 1].yaxis.get_minor_formatter())
# 出力:<matplotlib.ticker.EngFormatter object at 0x~>
# グラフ1-0
axs[1, 0].set_title('目盛りフォーマッタ設定 (文字列)')
axs[1, 0].plot(x, y)
axs[1, 0].set_xticks(x)
axs[1, 0].set_xticks([0.5, 1.5, 2.5], minor=True)
axs[1, 0].xaxis.set_major_formatter('{x:.1f}')
axs[1, 0].xaxis.set_minor_formatter('({x:.1f})')
print(axs[1, 0].xaxis.get_major_formatter())
# 出力:<matplotlib.ticker.StrMethodFormatter object at 0x~>
print(axs[1, 0].xaxis.get_minor_formatter())
# 出力:<matplotlib.ticker.StrMethodFormatter object at 0x~>
axs[1, 0].set_yticks(y)
axs[1, 0].set_yticks([500_000, 1_500_000, 2_500_000], minor=True)
axs[1, 0].yaxis.set_major_formatter('{x:.2e}')
axs[1, 0].yaxis.set_minor_formatter('({x:.2e})')
print(axs[1, 0].yaxis.get_major_formatter())
# 出力:<matplotlib.ticker.StrMethodFormatter object at 0x~>
print(axs[1, 0].yaxis.get_minor_formatter())
# 出力:<matplotlib.ticker.StrMethodFormatter object at 0x~>
# グラフ1-1
def x_major_formatter(x, pos):
if x == 0:
label = '0'
else:
label = f'{x:.1f}'
return label
def x_minor_formatter(x, pos):
label = f'({x:.2f})'
return label
def y_major_formatter(y, pos):
if y == 0:
label = '0'
else:
label = f'{y:.1e}'
return label
def y_minor_formatter(y, pos):
label = f'({y:.2e})'
return label
#
axs[1, 1].set_title('目盛りフォーマッタ設定 (関数)')
axs[1, 1].plot(x, y)
axs[1, 1].set_xticks(x)
axs[1, 1].set_xticks([0.5, 1.5, 2.5], minor=True)
axs[1, 1].xaxis.set_major_formatter(x_major_formatter)
axs[1, 1].xaxis.set_minor_formatter(x_minor_formatter)
print(axs[1, 1].xaxis.get_major_formatter())
# 出力:<matplotlib.ticker.FuncFormatter object at 0x~>
print(axs[1, 1].xaxis.get_minor_formatter())
# 出力:<matplotlib.ticker.FuncFormatter object at 0x~>
axs[1, 1].set_yticks(y)
axs[1, 1].set_yticks([500_000, 1_500_000, 2_500_000], minor=True)
axs[1, 1].yaxis.set_major_formatter(y_major_formatter)
axs[1, 1].yaxis.set_minor_formatter(y_minor_formatter)
print(axs[1, 1].yaxis.get_major_formatter())
# 出力:<matplotlib.ticker.FuncFormatter object at 0x~>
print(axs[1, 1].yaxis.get_minor_formatter())
# 出力:<matplotlib.ticker.FuncFormatter object at 0x~>
# 表示
plt.show()