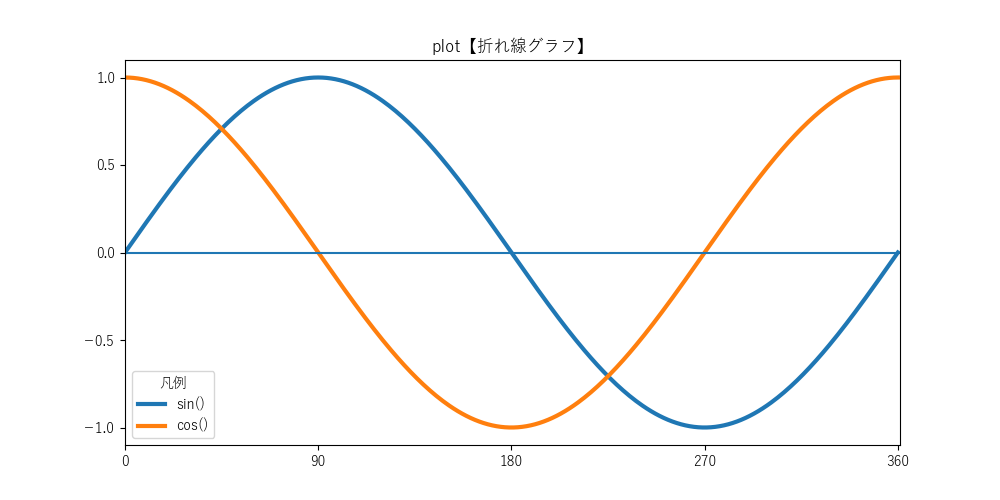
plot【折れ線グラフ】
メモ ( 基本 データの指定方法 線の指定方法 マーカーの指定方法 関連設定 ) 構文 設定・グラフパーツ 例
メモ
基本
〔 例 〕- x軸データ・y軸データを指定 (x軸データは省略可)
- デフォルトでデータ間は線で結合
- 同一のグラフに複数描画可能 (データの指定方法も参照)
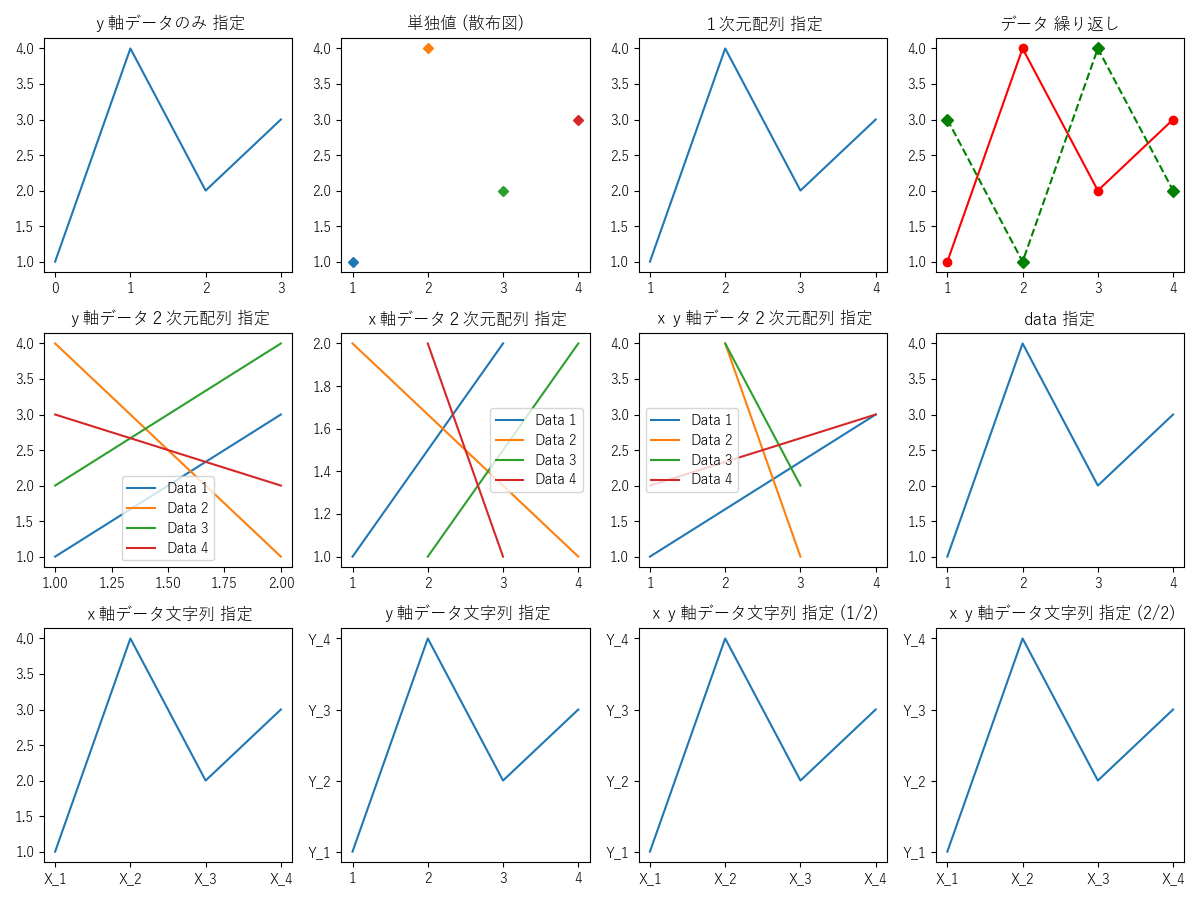
データの指定方法
〔 例 〕- y軸データのみ
- 単独値 (散布図:マーカーのサイズと色が同じ場合、scatter【散布図】より高速)
- 1次元配列を指定
- データの繰り返し (複数の折れ線作成)
- 片方あるいは両方の2次元配列可 (複数の折れ線作成)
- データ引数にラベル名を指定、data (ラベル名指定データ)にラベル名とデータを指定
- データを文字列指定 (連続データは文字列指定可、目盛りを固定し目盛りラベル設定で可能)
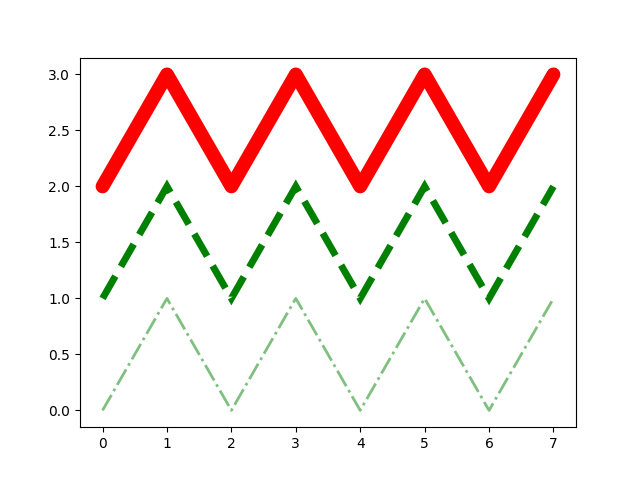
線の指定方法
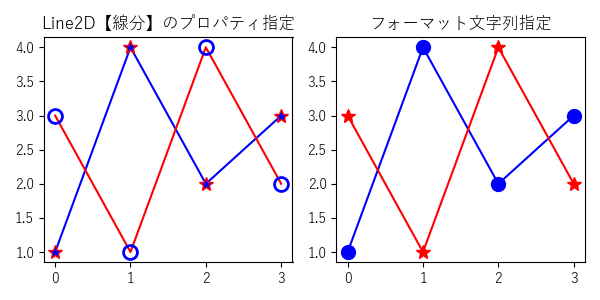
〔 例 〕マーカーの指定方法
〔 例 〕- マーカー定義 参照
alpha【アルファ値】 (線と共有)
fillstyle【マーカー塗りつぶしスタイル】
marker【マーカースタイル】 ・fmt【簡易スタイル】の簡易マーカースタイル
markeredgecolor・mec【マーカー外枠の色】
markeredgewidth・mew【マーカー外枠の幅】
markerfacecolor・mfc【マーカーの塗りつぶし色】 ・fmt【簡易スタイル】の簡易色 (線の色と共有)
markerfacecoloralt・mfcalt【残り部分の塗りつぶし色】
markersize・ms【マーカーのサイズ】
markevery【マーカー頻度】 - 中抜き・白抜き:マーカー定義 のマーカーの中抜き・白抜き 参照
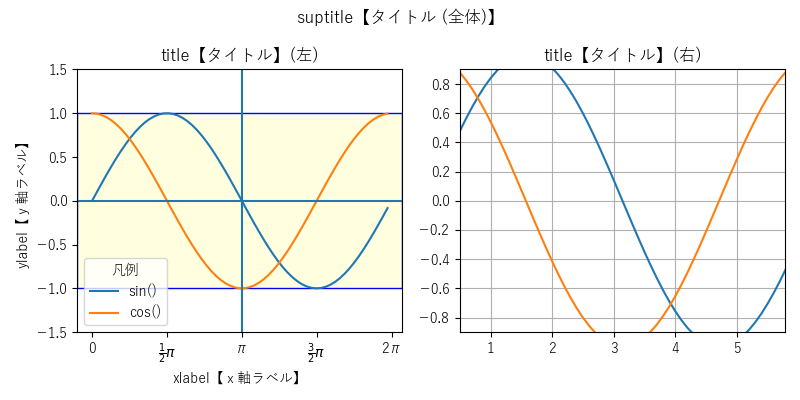
関連設定
〔 例 〕- タイトル・凡例・目盛り等:設定・グラフパーツ 参照
関連
- マーカー定義
- 色定義
- step【折れ線グラフ (ステップ)】
- stairs【折れ線グラフ (段階的定数)】3.4
- plot_date【折れ線グラフ (時系列)】
- stackplot【折れ線グラフ (積み上げ)】
- scatter【散布図】
- Axes3D.plot (plot3D)【3D折れ線グラフ】
外部リンク
構文
matplotlib.pyplot.plot(
    *args (x軸データ・y軸データ・簡易スタイル)※data,
    scalex (bool:x軸自動スケーリング有無)=True,
    scaley (bool:y軸自動スケーリング有無)=True,
    data (ラベル名指定データ)=None,
    **kwargs (Line2D【線分】プロパティ))
matplotlib.axes.Axes.plot(同上)
戻り値Line2D【線分】 のリスト

args (可変長位置引数)下記が有効 (位置引数としてのみ有効)
    [x,] y[, fmt] の繰り返し (複数の折れ線作成)
        x (配列形式・スカラー:位置引数のみ)※datax軸データ (省略:[0, 1, 2, ...])
        y (配列形式・スカラー:位置引数のみ)※datay軸データ
        fmt (str:位置引数のみ)簡易スタイル (フォーマット文字列 指定)
scalex (bool:キーワード引数)x軸自動スケーリングの有無
scaley (bool:キーワード引数)y軸自動スケーリングの有無
data (キーワード引数)ラベル名指定データ (dict【辞書型】・pandas.DataFrame・構造化numpy配列 等)
    (※data:ラベル名指定可・詳細は、データの指定方法 参照・下記が対象)
    ・x (x軸データ)
    ・y (y軸データ)
kwargs (可変長キーワード引数)Line2D【線分】のプロパティ
フォーマット文字列
'[簡易marker (マーカースタイル)][簡易line (線種)][簡易color (色)]'
※:順不同
簡易マーカースタイル
- マーカースタイルの簡易指定
- marker【マーカースタイル】の一部のショートカット
- marker【マーカースタイル】を優先
| 簡易marker | マーカースタイル | |
|---|---|---|
| . (ドット) |  | ポイント point marker |
| , (カンマ) | ピクセル pixel marker | |
| o (オー) |  | 円 circle marker |
| v (ブイ) |  | 三角形 (下向き) triangle_down marker |
| ^ (山型アクセント記号) |  | 三角形 (上向き) triangle_up marker |
| < |  | 三角形 (左向き) triangle_left marker |
| > |  | 三角形 (右向き) triangle_right marker |
| 1 |  | 三芒星 (下向き) tri_down marker |
| 2 |  | 三芒星 (上向き) tri_up marker |
| 3 |  | 三芒星 (左向き) tri_left marker |
| 4 |  | 三芒星 (右向き) tri_right marker |
| 8 3.4 |  | 八角形 octagon |
| s |  | 四角形 square marker |
| p |  | 五角形 pentagon marker |
| P 3.4 |  | プラス記号 (塗りつぶし) plus (filled) marker |
| * |  | 星印 star marker |
| h |  | 六角形 (1) hexagon1 marker |
| H |  | 六角形 (2) hexagon2 marker |
| + |  | プラス記号 plus marker |
| x |  | バツ印 x marker |
| X 3.4 |  | バツ印 (塗りつぶし) x (filled) marker |
| D |  | ダイヤモンド diamond marker |
| d |  | ダイヤモンド (縦長) thin_diamond marker |
| | |  | 垂直線 vline marker |
| _ (アンダースコア) |  | 水平線 hline marker |
簡易線種
- 線スタイルの簡易指定
- linestyle【線スタイル】の一部のショートカット
- linestyle【線スタイル】を優先
| 簡易line | 線種 | |
|---|---|---|
| - |  | 実線 |
| -- |  | 破線 dashed line style |
| -. |  | 一点鎖線 dash-dot line style |
| : |  | 点線 dotted line style |
簡易色
- 線とマーカーの色の簡易指定
- color【線の色】・markerfacecolor【マーカー塗りつぶし色】の一部のショートカット
- color【線の色】を優先
| color | 備考 | ||
|---|---|---|---|
| b | blue | 詳細は 色名の省略形 (1文字) 参照 | |
| g | green | ||
| r | red | ||
| c | cyan | ||
| m | magenta | ||
| y | yellow | ||
| k | key (black) | ||
| w | white | ||
| Cn | ― | CNカラー (n:色番号) 詳細は CN カラー 参照 簡易marker (マーカースタイル)の数字指定との組合せに注意 | |
| その他 | ― | 色の単独指定の場合、全ての 色定義 の指定が可能 | |
Line2D【線分】のプロパティ
| プロパティ | 型 | デフォルト | get_* | set_* | 備考 | ||||||||||||||||||||||||
|---|---|---|---|---|---|---|---|---|---|---|---|---|---|---|---|---|---|---|---|---|---|---|---|---|---|---|---|---|---|
| agg_filter | callable | Artist | Artist | agg フィルター | |||||||||||||||||||||||||
| alpha | スカラー None | Artist | Artist | アルファ値 (0:透明 ~ 1:不透明) (線とマーカー共有) | |||||||||||||||||||||||||
| animated | bool | Artist | Artist | アニメーション使用の有無 | |||||||||||||||||||||||||
| antialiased aa 3.1 | bool | ● ● | ● ● | アンチエイリアス処理の有無 | |||||||||||||||||||||||||
| clip_box | Bbox | Artist | Artist | ||||||||||||||||||||||||||
| clip_on | bool | Artist | Artist | クリッピングの有無 (True:範囲内のみ描画 / False:範囲外にも描画可) | |||||||||||||||||||||||||
| clip_path | Patch (Path, Transform) None | Artist | Artist | ||||||||||||||||||||||||||
| color c 3.1 | color【色定義】 | ● ● | ● ● | 線の色 | |||||||||||||||||||||||||
| contains 3.3 | callable | get_pickradius | set_pickradius | ピッカーイベント (参照:picker【ピッカーイベント】) | |||||||||||||||||||||||||
| dash_capstyle | CapStyle3.4 str | 'projecting' | ● | ● | 実線以外の線端スタイル (実線は solid_capstyle 参照)
| ||||||||||||||||||||||||
| dash_joinstyle | JoinStyle3.4 str | 'round' | ● | ● | 実線以外の結合スタイル (実線は solid_joinstyle 参照)
| ||||||||||||||||||||||||
| dashes | sequence of floats (on/off ink in points) (None, None) | get_linestyle | ● | ||||||||||||||||||||||||||
| data | (2, N) array two 1D arrays | ● | ● | ||||||||||||||||||||||||||
| drawstyle ds 3.1 | str | 'default' | ● ● | ● ● | 線の接続スタイル
| ||||||||||||||||||||||||
| figure | Figure | Artist | Artist | 所属フィギュア | |||||||||||||||||||||||||
| fillstyle | str | ● | ● | マーカー塗りつぶしスタイル (参照:markerfacecolor・markerfacecoloralt)
| |||||||||||||||||||||||||
| gapcolor 3.6 | color【色定義】 None | ● | ● | 破線スタイルのギャップ色 | |||||||||||||||||||||||||
| gid | str | Artist | Artist | グループId (識別子として利用可) | |||||||||||||||||||||||||
| in_layout | bool | Artist | Artist | レイアウト計算に含めるか否か | |||||||||||||||||||||||||
| label | object | Artist | Artist | 凡例ラベル (アンダースコアで始まるラベルは対象外) | |||||||||||||||||||||||||
| linestyle ls 3.1 | str (offset, on-off-seq) | ● ● | ● ● | 線種
| |||||||||||||||||||||||||
| linewidth lw 3.1 | float | ● ● | ● ● | 線の幅 | |||||||||||||||||||||||||
| marker | str Path MarkerStyle | ● | ● | マーカースタイル (詳細は、マーカー定義 参照) | |||||||||||||||||||||||||
| markeredgecolor mec 3.1 | color【色定義】 | ● ● | ● ● | マーカー外枠の色 | |||||||||||||||||||||||||
| markeredgewidth mew 3.1 | float | ● ● | ● ● | マーカー外枠の幅 | |||||||||||||||||||||||||
| markerfacecolor mfc 3.1 | color【色定義】 | ● ● | ● ● | マーカーの塗りつぶし色 (参考:fillstyle) | |||||||||||||||||||||||||
| markerfacecoloralt mfcalt 3.1 | color【色定義】 | ● ● | ● ● | fillstyle【マーカー塗りつぶしスタイル】指定の残り部分の塗りつぶし色 | |||||||||||||||||||||||||
| markersize ms 3.1 | float | ● ● | ● ● | マーカーのサイズ (ポイント単位) | |||||||||||||||||||||||||
| markevery | 各種 (マーカー頻度 参照) | ● | ● | マーカー頻度 (詳細 参照) | |||||||||||||||||||||||||
| path_effects | AbstractPathEffect | Artist | Artist | ||||||||||||||||||||||||||
| picker | callable[[Artist, Event], tuple[bool, dict]] float 3.3 | Artist | ● | callable:ピッカーイベント float:ピッカー有効半径 (参照:contains【ピッカーイベント】3.3 ) | |||||||||||||||||||||||||
| pickradius | float | ● | ● | ピッカー有効半径 | |||||||||||||||||||||||||
| rasterized | bool | Artist | Artist | ラスタライズ(ビットマップ) 描画の強制有無 | |||||||||||||||||||||||||
| sketch_params | (scale: float, length: float, randomness: float) | Artist | Artist | ||||||||||||||||||||||||||
| snap | bool None | Artist | Artist | スナップ (ピクセル位置補正) の有無 (Agg・MacOSX バックエンドのみサポート) | |||||||||||||||||||||||||
| solid_capstyle | CapStyle3.4 str | 'projecting' | ● | ● | 実線の線端スタイル (実線以外は dash_capstyle 参照)
| ||||||||||||||||||||||||
| solid_joinstyle | JoinStyle3.4 str | 'round' | ● | ● | 実線の結合スタイル (実線以外は dash_joinstyle 参照)
| ||||||||||||||||||||||||
| transform | matplotlib.transforms.Transform | Artist | ● | 座標変換 | |||||||||||||||||||||||||
| url | str | Artist | Artist | ハイパーリンクURL (SVG のみ対応) | |||||||||||||||||||||||||
| visible | bool | Artist | Artist | 表示有無 | |||||||||||||||||||||||||
| xdata | 1D array | ● | ● | x軸データ | |||||||||||||||||||||||||
| ydata | 1D array | ● | ● | y軸データ | |||||||||||||||||||||||||
| zorder | float | Artist | Artist | Zオーダー (大きい方が手前) | |||||||||||||||||||||||||


設定・グラフパーツ
| pyplot. | axes.Axes. | その他 | |
|---|---|---|---|
| タイトル | suptitle【タイトル設定 (全体)】 title【タイトル設定】 | set_title【タイトル設定】 get_title【タイトル取得】 Axes3D.set_title【タイトル設定】 | figure.Figure.suptitle【タイトル設定 (全体)】 figure.SubFigure.suptitle figure.Figure.align_titles【タイトル調整】3.9 |
| 凡例 | legend【凡例 設定】3.5 / 3.7 / 3.8 quiverkey【ベクトルの凡例 追加】 | figure.Figure.legend【凡例 設定 (全体)】3.7 / 3.8 PathCollection.legend_elements【凡例項目作成】 | |
| get_legend【凡例 取得】 get_legend_handles_labels【凡例 取得 (ハンドル・ラベル)】 | |||
| 軸ラベル | xlabel【x軸ラベル 設定】3.3 ylabel【y軸ラベル 設定】3.3 | set_xlabel【x軸ラベル 設定】3.3 set_ylabel【y軸ラベル 設定】3.3 Axes3D.set_zlabel【z軸ラベル 設定】 get_xlabel【x軸ラベル 取得】 get_ylabel【y軸ラベル 取得】 Axes3D.get_zlabel【z軸ラベル 取得】 | align_labels【ラベル調整】 figure.Figure.supxlabel【x軸ラベル(全体) 設定】3.43.6 figure.Figure.supylabel【y軸ラベル(全体) 設定】3.43.6 figure.SubFigure.supxlabel figure.SubFigure.supylabel projections.polar.PolarAxes.set_rlabel_position【半径ラベルのシータ位置設定】 |
| clabel【等高線ラベル 設定】 | |||
| グリッド線 | grid【グリッド線 設定】3.5 | grid【グリッド線 設定】3.5 get_xgridlines【x軸グリッド線 取得】 get_ygridlines【y軸グリッド線 取得】 (Axes3D.grid【3Dグリッド線 取得・設定】) Axes3D.get_zgridlines【z軸グリッド線 取得】 | axis.Axis.grid【軸グリッド線 設定】3.5 axis.Axis.get_gridlines【軸グリッド線 取得】 |
| triplot【三角形分割】 | |||
| rgrids【放射状グリッド線 取得・設定】 thetagrid【放射状シータグリッド線 取得・設定】 | projections.polar.PolarAxes.set_rgrids【放射状グリッド線 設定】 projections.polar.PolarAxes.set_thetagrid【放射状シータグリッド線 設定】 | ||
| 表示範囲 | xlim【x軸表示範囲 取得・設定】 ylim【y軸表示範囲 取得・設定】 axis【表示範囲等 取得・設定】3.1~3.4 / 3.7 | set_xlim【x軸表示範囲 設定】3.1 / 3.6 set_ylim【y軸表示範囲 設定】3.1 / 3.6 get_xlim【x軸表示範囲 取得】 get_ylim【y軸表示範囲 取得】 axis【表示範囲等 取得・設定】3.1~3.4 / 3.7 | projections.polar.PolarAxes.set_rlim【極座標範囲 設定】 |
| Axes3D.set_xlim【3D x軸表示範囲 設定】 Axes3D.set_xlim3d【3D x軸表示範囲 設定】 Axes3D.set_ylim【3D y軸表示範囲 設定】 Axes3D.set_ylim3d【3D y軸表示範囲 設定】 Axes3D.set_zlim【3D z軸表示範囲 設定】 Axes3D.set_zlim3d【3D z軸表示範囲 設定】 Axes3D.get_xlim3d【3D x軸表示範囲 取得】 Axes3D.get_ylim3d【3D y軸表示範囲 取得】 Axes3D.get_zlim3d【3D z軸表示範囲 取得】 | |||
| データ上限・下限 | set_xbound【x軸データ上限・下限 設定】 set_ybound【y軸データ上限・下限 設定】 get_xbound【x軸データ上限・下限 取得】 get_ybound【y軸データ上限・下限 取得】 | projections.polar.PolarAxes.set_rmax【極座標上限 設定】 projections.polar.PolarAxes.set_rmin【極座標下限 設定】 | |
| 目盛り | xticks【x軸目盛り (ラベル) 取得・設定】3.6 yticks【y軸目盛り (ラベル) 取得・設定】3.6 locator_params【目盛り制御】 minorticks_on minorticks_off ticklabel_format【目盛りフォーマット設定 (指数形式)】 tick_params【目盛り・グリッド線 外観変更】 | set_xticks【x軸目盛り 設定】3.2 / 3.5 set_yticks【y軸目盛り 設定】3.2 / 3.5 Axes3D.set_zticks【z軸目盛り 設定】 set_xticklabels【x軸目盛りラベル 設定】3.3 / 3.5 set_yticklabels【y軸目盛りラベル 設定】3.3 / 3.5 Axes3D.set_zticklabels【z軸目盛りラベル 設定】 get_xticks【x軸目盛り 取得】3.2 get_yticks【y軸目盛り 取得】3.2 Axes3D.get_zticks【z軸目盛り 取得】 get_xticklabels【x軸目盛りラベル 取得】3.3 / 3.6 get_yticklabels【y軸目盛りラベル 取得】3.3 / 3.6 Axes3D.get_zticklabels【z軸目盛りラベル 取得】 get_xmajorticklabels【x軸目盛りラベル 取得 (主)】3.3 / 3.6 get_ymajorticklabels【y軸目盛りラベル 取得 (主)】3.3 / 3.6 get_xminorticklabels【x軸目盛りラベル 取得 (補助)】3.3 / 3.6 get_yminorticklabels【y軸目盛りラベル 取得 (補助)】3.3 / 3.6 get_xticklines get_yticklines xaxis_date yaxis_date minorticks_on minorticks_off ticklabel_format【目盛りフォーマット設定 (指数形式)】 tick_params【目盛り・グリッド線 外観変更】 locator_params【目盛り制御】 fmt_xdata fmt_ydata | ticker【目盛りモジュール】 axis.Axis.set_ticks【目盛り 設定】 axis.Axis.set_ticklabels【目盛りラベル 設定】 axis.Axis.set_tick_params【目盛り・グリッド線 外観変更】 axis.XAxis.set_ticks_position【x軸目盛り位置 設定】 axis.YAxis.set_ticks_position【y軸目盛り位置 設定】 Axes3D.locator_params【目盛り制御】 axis.Axis.set_major_formatter【フォーマッタ設定 (主)】 axis.Axis.set_minor_formatter【フォーマッタ設定 (補助)】 axis.Axis.set_major_locator【ロケータ設定 (主)】 axis.Axis.set_minor_locator【ロケータ設定 (補助)】 axis.Axis.get_ticklabels【目盛りラベル取得】 axis.Axis.get_majorticklabels【目盛りラベル取得 (主)】 axis.Axis.get_minorticklabels【目盛りラベル取得 (補助)】 axis.Axis.get_major_formatter【フォーマッタ取得 (主)】 axis.Axis.get_minor_formatter【フォーマッタ取得 (補助)】 axis.Axis.get_ticklocs axis.Axis.get_major_locator【ロケータ取得 (主)】 axis.Axis.get_minor_locator【ロケータ取得 (補助)】 figure.Figure.autofmt_xdate【x軸日付目盛りラベル回転】 axis.Axis.get_tick_params【目盛り・グリッド線 外観取得】3.7 |
| 直線 範囲 | axhline【水平線 (単一)】3.9 axvline【垂直線 (単一)】 hlines【水平線 (複数)】3.3 vlines【垂直線 (複数)】3.3 axhspan【水平範囲】3.9 axvspan【垂直範囲】3.9 axline【直線】3.3 | ||
例
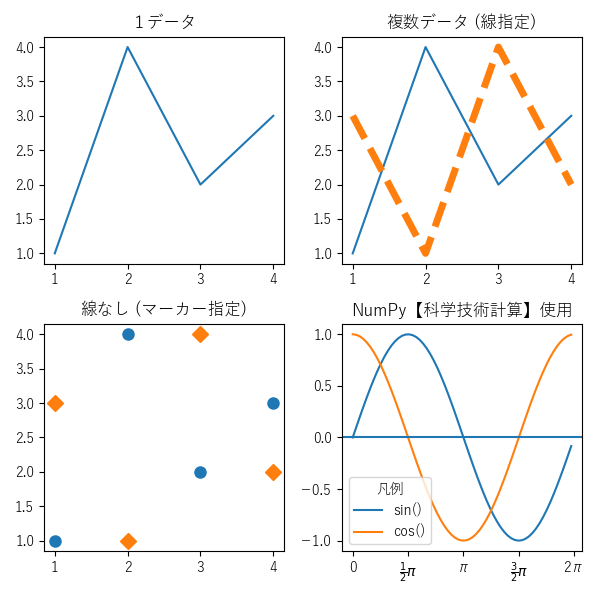
折れ線グラフの基本
import matplotlib.pyplot as plt
import numpy as np

# 初期設定
plt.rcParams['font.family'] = 'sans-serif'
plt.rcParams['font.sans-serif'] =\
    ['Yu Gothic', 'Hiragino Maru Gothic Pro', 'Noto Sans CJK JP']
fig, axs = plt.subplots(
    2,
    2,
    figsize=(6, 6),
    tight_layout=True,
)

# 1データ
axs[0, 0].set_title('1データ')
axs[0, 0].plot(
    [1, 2, 3, 4],
    [1, 4, 2, 3],
)

# 複数データ (線指定)
axs[0, 1].set_title('複数データ (線指定)')
axs[0, 1].plot(
    [1, 2, 3, 4],
    [1, 4, 2, 3],
)
axs[0, 1].plot(
    [1, 2, 3, 4],
    [3, 1, 4, 2],
    linestyle='--',
    linewidth=5,
)

# 線なし (マーカー指定)
axs[1, 0].set_title('線なし (マーカー指定)')
axs[1, 0].plot(
    [1, 2, 3, 4],
    [1, 4, 2, 3],
    linestyle='',
    marker='o',
    markersize=8,
)
axs[1, 0].plot(
    [1, 2, 3, 4],
    [3, 1, 4, 2],
    linestyle='',
    marker='D',
    markersize=8,
)

# NumPy【科学技術計算】使用
axs[1, 1].set_title('NumPy【科学技術計算】使用')
x = np.arange(0, np.pi*2, 0.1)
y_sin = np.sin(x)
y_cos = np.cos(x)
axs[1, 1].plot(x, y_sin, label='sin()')
axs[1, 1].plot(x, y_cos, label='cos()')
axs[1, 1].legend(title='凡例')
axs[1, 1].set_xticks([0, np.pi*0.5, np.pi, np.pi*1.5, np.pi*2])
axs[1, 1].set_xticklabels(['0', r'$\frac{1}{2}π$', 'π', r'$\frac{3}{2}π$', '2π'])
axs[1, 1].set_yticks([-1, -0.5, 0, 0.5, 1])
axs[1, 1].axhline(0)

# 表示
plt.show()
データの指定方法
import matplotlib.pyplot as plt

# 初期設定
plt.rcParams['font.family'] = 'sans-serif'
plt.rcParams['font.sans-serif'] =\
    ['Yu Gothic', 'Hiragino Maru Gothic Pro', 'Noto Sans CJK JP']
fig, axs = plt.subplots(
    3,
    4,
    figsize=(12, 9),
    tight_layout=True,
)

# y軸データのみ 指定
axs[0, 0].set_title('y軸データのみ 指定')
axs[0, 0].plot(
    [1, 4, 2, 3],
)

# 単独値 (散布図)
axs[0, 1].set_title('単独値 (散布図)')
style = 'D'
size = 5
axs[0, 1].plot(1, 1, marker=style, markersize=size)
axs[0, 1].plot(2, 4, marker=style, markersize=size)
axs[0, 1].plot(3, 2, marker=style, markersize=size)
axs[0, 1].plot(4, 3, marker=style, markersize=size)

# 1次元配列 指定
axs[0, 2].set_title('1次元配列 指定')
axs[0, 2].plot(
    [1, 2, 3, 4],
    [1, 4, 2, 3],
)

# データ 繰り返し
axs[0, 3].set_title('データ 繰り返し')
axs[0, 3].plot(
    [1, 2, 3, 4], [1, 4, 2, 3], 'o-r',
    [1, 2, 3, 4], [3, 1, 4, 2], 'D--g',
)

# y軸データ2次元配列 指定
axs[1, 0].set_title('y軸データ2次元配列 指定')
axs[1, 0].plot(
    [1, 2],
    [[1, 4, 2, 3], [3, 1, 4, 2]],
    label=['Data 1', 'Data 2', 'Data 3', 'Data 4'],
)
axs[1, 0].legend()

# x軸データ2次元配列 指定
axs[1, 1].set_title('x軸データ2次元配列 指定')
axs[1, 1].plot(
    [[1, 4, 2, 3], [3, 1, 4, 2]],
    [1, 2],
    label=['Data 1', 'Data 2', 'Data 3', 'Data 4'],
)
axs[1, 1].legend()

# xy軸データ2次元配列 指定
axs[1, 2].set_title('xy軸データ2次元配列 指定')
axs[1, 2].plot(
    [[1, 2, 3, 4], [4, 3, 2, 1]],
    [[1, 4, 2, 3], [3, 1, 4, 2]],
    label=['Data 1', 'Data 2', 'Data 3', 'Data 4'],
)
axs[1, 2].legend()

# data 指定
axs[1, 3].set_title('data 指定')
axs[1, 3].plot(
    'data_x',
    'data_y',
    data={
        'data_x': [1, 2, 3, 4],
        'data_y': [1, 4, 2, 3],
    },
)

# x軸データ文字列 指定
axs[2, 0].set_title('x軸データ文字列 指定')
axs[2, 0].plot(
    ['X_1', 'X_2', 'X_3', 'X_4'],
    [1, 4, 2, 3],
)

# y軸データ文字列 指定
axs[2, 1].set_title('y軸データ文字列 指定')
axs[2, 1].plot(
    [1, 2, 3, 4],
    [1, 4, 2, 3],
)
axs[2, 1].set_yticks([1, 2, 3, 4])
axs[2, 1].set_yticklabels(['Y_1', 'Y_2', 'Y_3', 'Y_4'])

# xy軸データ文字列 指定 (1/2)
axs[2, 2].set_title('xy軸データ文字列 指定 (1/2)')
axs[2, 2].plot(
    ['X_1', 'X_2', 'X_3', 'X_4'],
    [1, 4, 2, 3],
)
axs[2, 2].set_yticks([1, 2, 3, 4])
axs[2, 2].set_yticklabels(['Y_1', 'Y_2', 'Y_3', 'Y_4'])

# xy軸データ文字列 指定 (2/2)
axs[2, 3].set_title('xy軸データ文字列 指定 (2/2)')
axs[2, 3].plot(
    [1, 2, 3, 4],
    [1, 4, 2, 3],
)
axs[2, 3].set_xticks([1, 2, 3, 4])
axs[2, 3].set_xticklabels(['X_1', 'X_2', 'X_3', 'X_4'])
axs[2, 3].set_yticks([1, 2, 3, 4])
axs[2, 3].set_yticklabels(['Y_1', 'Y_2', 'Y_3', 'Y_4'])

# 表示
plt.show()
線の指定方法
import matplotlib.pyplot as plt

# 初期設定
fig, ax = plt.subplots()
# グラフ1
ax.plot(
    [2, 3, 2, 3, 2, 3, 2, 3],
    'r-',
    linewidth=10,
    solid_capstyle='round',
    solid_joinstyle='round',
)
# グラフ2
ax.plot(
    [1, 2, 1, 2, 1, 2, 1, 2],
    color='green',
    linewidth=5,
    linestyle='--',
    dash_capstyle='butt',
    dash_joinstyle='miter',
)
# グラフ3
ax.plot(
    [0, 1, 0, 1, 0, 1, 0, 1],
    color='green',
    alpha=0.5,
    linewidth=2,
    linestyle='-.',
)
# 表示
plt.show()
マーカーの指定方法
import matplotlib.pyplot as plt

# 初期設定
plt.rcParams['font.family'] = 'sans-serif'
plt.rcParams['font.sans-serif'] =\
    ['Yu Gothic', 'Hiragino Maru Gothic Pro', 'Noto Sans CJK JP']
fig, axs = plt.subplots(
    1,
    2,
    figsize=(6, 3),
    tight_layout=True,
)

# データ
data_y1 = [1, 4, 2, 3]
data_y2 = [3, 1, 4, 2]

# Line2D【線分】のプロパティ指定
axs[0].set_title('Line2D【線分】のプロパティ指定')
axs[0].plot(
    data_y1,
    color='blue',
    marker='*',
    markeredgecolor='red',
    markeredgewidth=1,
    markerfacecolor='blue',
    markersize=10,
)
axs[0].plot(
    data_y2,
    color='red',
    marker='o',
    markeredgecolor='blue',
    markeredgewidth=2,
    fillstyle='none',
    markersize=10,
)

# フォーマット文字列指定
axs[1].set_title('フォーマット文字列指定')
axs[1].plot(
    data_y1,
    'o-b',
    data_y2,
    '*-r',
    markersize=10,
)

# 表示
plt.show()
設定・グラフパーツ
import matplotlib.pyplot as plt
import numpy as np

# 初期設定
plt.rcParams['font.family'] = 'sans-serif'
plt.rcParams['font.sans-serif'] =\
    ['Yu Gothic', 'Hiragino Maru Gothic Pro', 'Noto Sans CJK JP']
fig, axs = plt.subplots(
    1,
    2,
    figsize=(8, 4),
    tight_layout=True,
)
plt.suptitle('suptitle【タイトル (全体)】')

# データ
x = np.arange(0, np.pi*2, 0.1)
y_sin = np.sin(x)
y_cos = np.cos(x)

# 左グラフ
axs[0].plot(x, y_sin, label='sin()')
axs[0].plot(x, y_cos, label='cos()')
# タイトル 設定
axs[0].set_title('title【タイトル】(左)')
# 凡例 設定
axs[0].legend(title='凡例')
# 軸ラベル 設定
axs[0].set_xlabel('xlabel【x軸ラベル】')
axs[0].set_ylabel('ylabel【y軸ラベル】')
# 表示範囲 設定
axs[0].set_ylim(-1.5, 1.5)
# 目盛り 設定
axs[0].set_xticks([0, np.pi*0.5, np.pi, np.pi*1.5, np.pi*2])
axs[0].set_yticks([-1.5, -1, -0.5, 0, 0.5, 1, 1.5])
# 目盛りラベル 設定
axs[0].set_xticklabels(['0', r'$\frac{1}{2}π$', 'π', r'$\frac{3}{2}π$', '2π'])
# 水平線・垂直線 追加
axs[0].axhline(0)
axs[0].axvline(np.pi)
# 範囲 追加
axs[0].axhspan(-1, 1, facecolor='lightyellow', edgecolor='blue')

# 右グラフ
axs[1].plot(x, y_sin, label='sin()')
axs[1].plot(x, y_cos, label='cos()')
# タイトル 設定
axs[1].set_title('title【タイトル】(右)')
# データ上限・下限 設定
axs[1].set_xbound(0.5, np.pi*2 - 0.5)
axs[1].set_ybound(-0.9, 0.9)
# グリッド設定
axs[1].grid()

# 表示
plt.show()